CO2 Levels Breach 400 ppm, To Remain For Our Lifetime
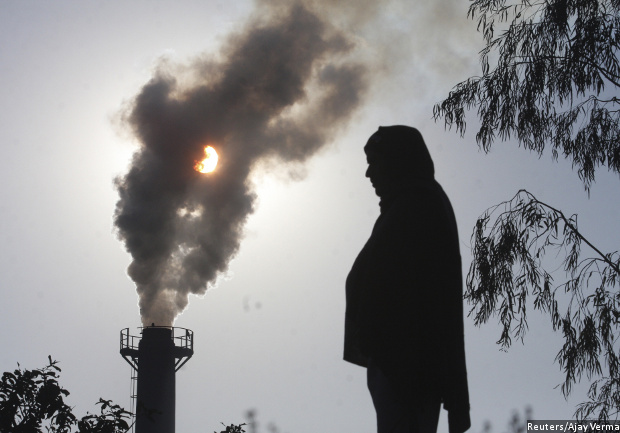
Smoke rises from a chimney of a garbage processing plant on the outskirts of the northern Indian city of Chandigarh. The record CO2 rise–3.1 ppm against the annual average of 2.1 ppm–this year has both natural and human origins.
CO2 concentration levels in the atmosphere have risen above 400 parts per million (ppm) for the second year in succession, but this time they will endure for our lifetimes, according to scientists at the Mauna Loa Observatory in Hawaii, global record-keeper of carbon emissions since the 1950s.
“Our forecast supports the suggestion that Mauna Loa record will never again show CO2 concentrations below the symbolic 400 ppm within our lifetime,” said a recently-published study, conducted by scientists from UK’s Met Office Hadley Centre and Ralph Keeling of the Scripps Institution of Oceanography in La Jolla, California, and published in Nature Climate Change.
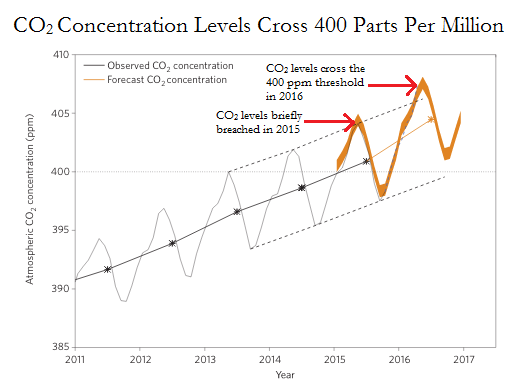
CO2 levels breached 400 ppm level last year as well, but when scientists last studied the data during September and October 2015, CO2 at Mauna Loa was below 400 ppm (latest reading for week ending June 26, 2016 was 406.23).
“Knowing that CO2 levels have passed this threshold feels quite profound, showing again that humans have made their mark on the Earth's climate,” Professor Richard Betts of the Met’s Hadley Centre and Exeter University and the lead author of the study told IndiaSpend. “My first reaction was a small sense of nostalgia and even sadness, realising that this was probably the last time those numbers would be measured there.”
The paper predicts increasing CO2 concentration in the atmosphere. High levels of CO2 and other gases--methane, nitrous oxide, ozone--and water vapour turn the atmosphere into a greenhouse, which lets in sunlight and traps heat that would otherwise escape into space.
This greenhouse effect has driven up the earth's average surface temperature from 0.6 to 0.9 deg C between 1906 and 2005, the rate of temperature increase nearly doubling over the last 50 years, according to the Earth Observatory of the US' National Aeronautics and Space Administration.
The 400-ppm level does not have immediate implications. “We did feel that it was a small but significant moment, realising that we had just passed through that threshold,” said Betts.
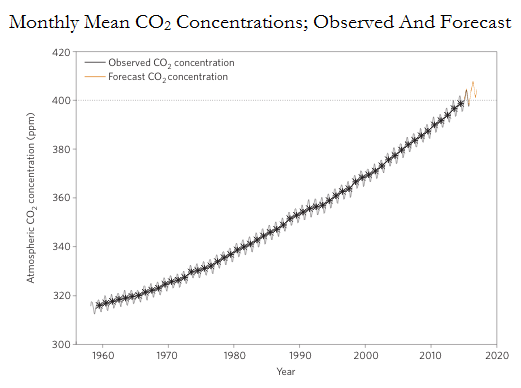
Monthly mean CO2 concentrations: Observed from 1957 to 2015 (black line); forecast (and back-tested with actuals) for 2015 and 2016 (orange line).
Expected changes in CO2 levels in the absence of El Nino, the warming of the Pacific Ocean near the equator. Dashed black lines indicate an educated guess of trends in annual maximum and minimum monthly values from previous years. Black and orange stars and central solid lines indicate observed and backtested (estimated inputs for past events) or forecast annual mean concentration since 2010.
Source: Richard A. Betts et al
The graph showing carbon dioxide levels is known as the Keeling Curve. In pre-industrial times, CO2 concentrations were at 280 ppm. They rose with the growth of industry and as the Keeling Curve shows, climbed still higher throughout 20th century. The Curve is saw-toothed because carbon dioxide levels fluctuate depending on the seasons. In some seasons, plants grow by absorbing carbon dioxide through photosynthesis, and in some seasons, they shed leaves, which decay and die.
2016's record CO2 rise has natural and human origins
The record CO2 rise--3.1 ppm against the annual average of 2.1 ppm--this year has both natural and human origins, the study said.
The extra 1 ppm is largely attributed to the impact of El Nino, the warming of the Equatorial Pacific that affects rainfall, dries out tropical land and ignites forest fires, which release CO2.
Even the recent normal 2.1 ppm per year increase is higher than it used to be, a consequence of human activity.
The overall trend of CO2 concentration is upward--once it is in the atmosphere, CO2 remains there for hundreds of years.
This is not the first time CO2 levels breached 400ppm. Last year, they crossed that level briefly and came down again. What the paper suggests is that CO2 will not come down below 400 ppm again because of the strong El Nino during 2015-16.
A foretaste of things to come
While the recent El Nino made this year's CO2 rise faster than recent years, it is also faster than the last time the world experienced a strong El Nino in 1997-98 because emissions have increased 25% since then, Betts explained.
“The datum point is 280 ppm. It has crossed 400 ppm. We are in the process of the whole thing building up," said Sagar Dhara, an independent environmental engineer and energy expert based in Hyderabad, who is not involved with the current study. "If we go down this road, obviously, the impact will be very visible.”
Emissions of CO2 and other greenhouse gases released by human activities, such as burning coal, oil and natural gas and deforestation, is warming the Earth every decade, with natural ups-and-downs intra-year within that trend.
The impacts have been visible in rising global sea levels (ice melts and water expanding as it warms), shifts in the locations and seasonal behaviour of many species and growing instances of extreme weather.
For instance, extreme rainfall events in central India, the core of the monsoon system, are increasing and moderate rainfall is decreasing—as a part of complex changes in local and world weather—according to a clutch of Indian and global studies reviewed by IndiaSpend in April 2015.
“Although this one single year's extra CO2 rise will not have an impact in itself, it is a reminder of ongoing changes in climate which would be expected to increase the risks of floods, droughts and disease, which often hit people living in poverty harder as they tend to be more vulnerable," said Betts, referring to vulnerable countries, such as India, Bangladesh and Sri Lanka and others.
(Varma is a freelance journalist based in Andhra Pradesh. He writes on science, with a special interest in climate science, environment and ecology.)
We welcome feedback. Please write to respond@indiaspend.org. We reserve the right to edit responses for language and grammar.
__________________________________________________________________
Liked this story? Indiaspend.org is a non-profit, and we depend on readers like you to drive our public-interest journalism efforts. Donate Rs 500; Rs 1,000, Rs 2,000.


