Delhi Climbs The Social Indicator Index But Struggles With Crime
| Highlights* Delhi's gross state domestic product (GSDP@ current prices) grew year on year at a mean average of 16% (using arithmetic mean method) since 1998.
*The average growth rate of 10.3% at (constant prices 2004-05) between 2005-06 to 2012-13 and average growth rate of 5.4% at (constant prices 1999-2000 prices) from 1999-2000 to 2003-04.
* Education spend up three-fold, steady at 1.6% of GSDP and health spend is 1.1% of the GSDP.
* Delhi ranks second in India in cases of atrocities against women |
Writing in Mumbai where we are based, one can only gaze in awe as the city-state of Delhi is lavished with riches in the form of good roads, a world class metro and an airport. Equally, we can only hope that the city’s poor track record in managing crime in general and against women in specific does not spread elsewhere and it has better success in fixing this menace.
But there’s also the local politics of Delhi, historically believed to be Indraprastha, the capital of the Pandavas in the Mahabharata.Elections will be held on December 4 with over 11.5 million voters eligible to cast their ballots in 70 constituencies.
The battle this time has become three-pronged between the ruling Congress, led by three-time Chief Minister Sheila Dikshit, Bharatiya Janata Party (BJP), which has named Dr Harsh Vardhan as their Chief Ministerial candidate and the Arvind Kejriwal-led Aam Aadmi Party (AAP).
While the polls and surveys have had a field day already, let’s look at what’s really happened on ground. And then look forward to the results to be announced on December 9 in this context.
Let us first break down the economy and then onto the social indicators.
Economic Performance
The economy is divided into three sectors:
- Primary sector (Agriculture and allied activities)
- Secondary sector (Manufacturing and other activities); and
- Tertiary sector(Trade and other services)
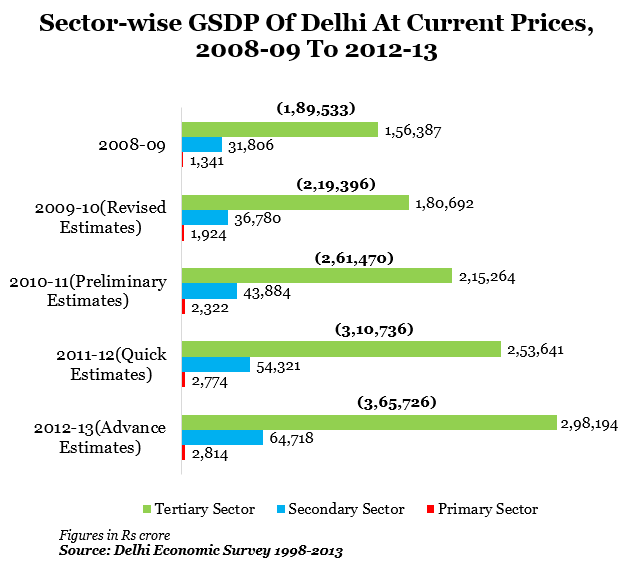
The tertiary sector has the largest share in the state’s GSDP with 81.5% in 2012-13(Advanced Estimates or AE). The sector grew at an average of 15.9% since 1998.
The secondary sector is the second largest contributor to the state’s GSDP with 17.7% in 2012-13(AE). The sector has grown at an average of 15.4% from 1998-99 to 2012-13.
The primary sector is almost negligible in Delhi and constituted just 0.8% of the state’s GSDP(current prices) in 2012-13 (AE). The sector has grown at an average 10.3% from 1998-99 to 2012-13.
Figure 1
Increased Spending on Education& Health
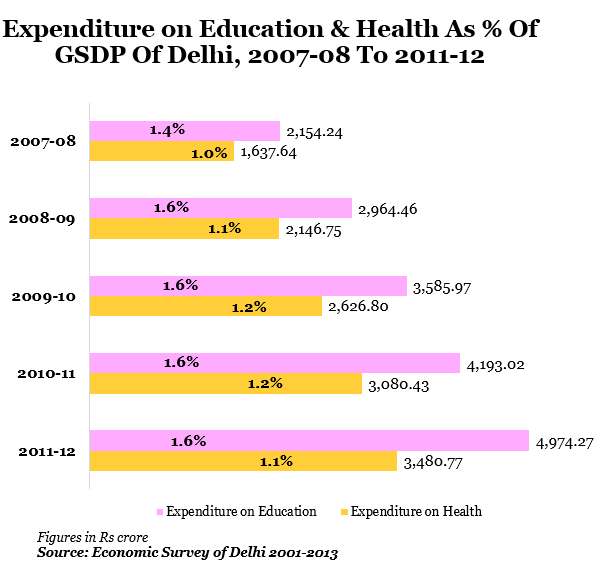
Expenditure on education in the state has increased three-fold. In 2004-05, Delhi’s expenditure on education was Rs 1,682 crores, which was 1.7% of GSDP. This increased to Rs4,974.3 crorein 2011-12, which was also around 1.6% of GSDP. Education expenditure for Mumbai in the 2011-12 was Rs. 1493 crores while Delhi was seen spending about 3 times more on education in comparison.
The year 2008-09 saw a 37.6% increase in expenditure on education, which was the largest increase followed by 2004-05 where expenditure increased by 32%. The year 2005-06 saw a decline in expenditure.
Expenditure on health has increased since 2004in Delhi, varying between 0.9%in 2004-05 of GSDP to 1.1% in 2011-12 of GSDP.The year 2009-10 saw the highest expenditure on health with 1.2% of GSDP being spent on health. Health expenditure in Mumbai in 2011-12 was Rs. 2167.5 crores which is much less than Delhi’s expenditure of Rs. 3,480.8 crores.
Figure 2
Literacy in Delhi was 86.4% in 2011. If we look at literacy rates in other metros in the country we see, Mumbai has a higher rate of literacy of 90.8% in 2011, while Kolkata was 88.3%.
The outcomes on education are reported by DISE (District Information System for Education) in a comprehensive manner but we will restrict ourselves to some key statistics under three heads:
- Infrastructure
- Enrolment
- Teachers
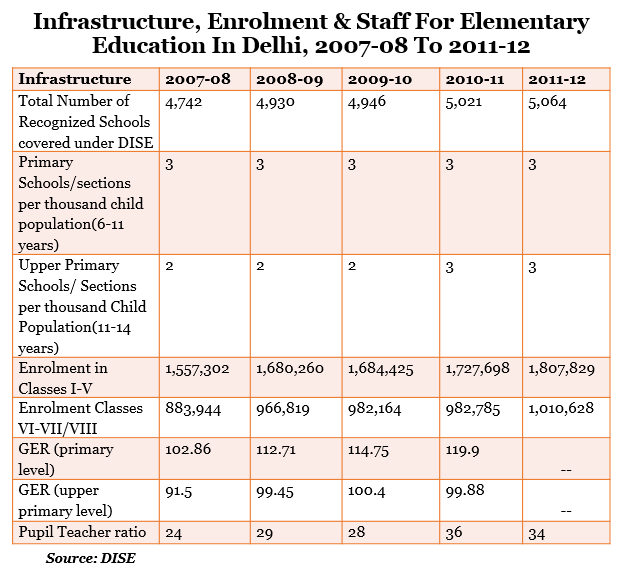
Delhi increased the number of elementary schools by 18.6% between 2004-05 and 2011-12 which is from 4,267 to 5,064 schools in 2011-12.
Enrolments for classes I-V increased more than the enrolment for upper primary (classes VI-VII/VIII) as can be seen from the Gross Enrolment Ratio or GER. While enrolments increased by 41.2% for classes I-V, it increased by 31.8% for classes VI-VII/VIII between 2004 and 2012.
The number of teachers has increased significantly by 28.1% from 64, 899 teachers in 2004 to 83, 121 teachers in 2011-12.
The average number of teachers per school increased from 14in 2004-05 to 16 in 2011-12. The year 2006-07 saw the highest number of teachers per school at 19 per school. It is not clear from the data we have why the number of teachers dropped from its peak.
Table 1
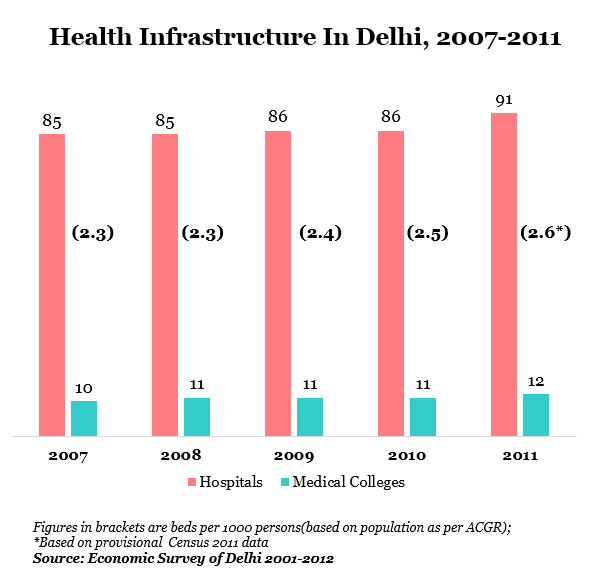
According to the recommendations of the World Health Organisation (WHO), the bed-population ratio target for year 2000 was 5 beds per 1,000 persons. In case of Delhi, the ratio was half the recommended ratio. While the number of beds has increased 30% since 2004, it does not seem to be enough. The year 2009 saw the largest increase in beds, which correlates with increased spending on health in 2008-09.
Figure 3
Delhi is doing well in key health targets. Crude birth, death and infant mortality rates are much lower than the all-India ratio, and have been declining since 2004.
Delhi’s birth rate was 18.4 in 1998 and has come down to 17.5 in 2011but the all-India birth rate come down by about 2. Same is the case with the death rate which was at 4.7 in 2004 and has come down to 4.3 in 2011.Infant mortality rate has come down by 14% in Delhi between 2004 and 2011.
If we do a comparison of health indicators between Delhi and Mumbai which has a similar population size, we see that in 2011 Mumbai’s death rate (per 1000) was 7.4 and Delhi’s death rate was 4.3 which is much lower. Infant mortality rate was also lower in Delhi for 2011 with 28; Mumbai was 29.53 for the same year. Delhi’s birth rate in 2011 was however higher at 17.5 compared to Mumbai which had a birth rate 13.5.
Table 2
Urban Development
The urban area in Delhi was 924.7 sq.km in 2001,which constituted 62% of the area of Delhi. This has increased to 1113.7 sq.km in 2011,which is 75% of the area of Delhi. The urban population in 2011 constituted 97.5% (16.3 million) of Delhi’s total population, an increase from the urban population in 2001 which was 93.2% (12.9 million) of Delhi’s population.
According to Economic Survey of Delhi 2012-13, the plan outlay for the 10th Five year plan was Rs. 2940.3 Crores which constituted 12.8% of the total plan outlay. The 11th Five year plan outlay was Rs. 5879.3 crores which constitutes 10.7 % of the total plan outlay.
If we look at the plan outlay for urban development under the 10th and 11thFive-Year Plan, we see that expenditure for the sector has almost doubled but its share of the total plan outlay has decreased in the 11thPlan compared to the previous plan. This is interesting as the area and population of the urban areas in Delhi has increased over the period of the decade.
The Government of National Capital Territory of Delhi (GNCTD) in 1995 entered into equity participation with Government of India in a 50:50 ratio i.e. equal participation to implement the MRTS project being implemented by the Delhi Metro Rail Corporation (DMRC) ltd. set-up in 1995. In all, the funds allocated or invested were: Rs. 4573 crores.
Delhi has increased its GSDP (at current prices) more than 6-fold since 1998 and almost 3-fold since 2004, growing at an average of 16% in the period which is significant. Delhi has been able to do this through the growth of its service sector. The state has done well to step up education spend and enrolment ratios for both primary and upper primary schools have seen marked increases. However, pupil-teacher ratio is something that hasn’t improved much and there is room for improvement.
Delhi has been ahead of the national ratios for its key health targets although it has to improve its health infrastructure to match international standards being the capital of the country and one of the major cities in India. Having said that, the work on ground looks better from where we are sitting. But that was not a new debate, was it.
Editors Note: A rushed version of this report had a higher Delhi GDP number on the headline thanks to our use of GDP on current prices. While that was technically correct and the source is accurate (Delhi Government's Economic Survey) the GDP as per constant prices is what is commonly used and understood.
And we've subsequently used 2005 as a starting point for that. Our thanks to economist Dr Surjit Bhalla for pointing this out. We also changed the headline and are stating the obvious - how the social indicators seem relatively strong but crime, particularly against women is a key issue. To reiterate: no content in terms of data has been changed since the original publication of this article.


