India At 70: What A Comparison With 5 Nations Reveals
In the 70 years since independence, India has made most progress in improving life expectancy, literacy, but has been slower in improving the level of income, and reducing infant mortality rates when compared to five other nations.
On the eve of independence day, we compared the progress India has made in improving income, health, education, and in preserving its forests, to five countries--China, Pakistan, Malaysia, South Korea and Brazil.
Why we chose these countries
We chose China because it had roughly the same per capita income in 1960 as India did. Our analysis showed that even though China and India are constantly compared, until now, China has outperformed India across most wealth and health indicators.
We looked at South Korea to get a sense of how India performed compared to a country that has gone from being a developing to a developed country after 1947.
We used Pakistan to compare progress in a country that shares the same history and culture, and was formed at the same time as India.
Brazil, one of the BRICS (Brazil, Russia, India, China and South Africa) countries, serves as a comparison with another emerging economy that is estimated to become one of the largest in the world over the next 30 years.
We picked Malaysia because it is, like India, multicultural and, although it was more prosperous than India when independence came, it has weathered significant ethnic tension and conflict. It represents the unique dynamism of a region, southeast Asia, in close proximity to India.
In 56 years, Indian income up 21 times, but progress slower than China, Malaysia
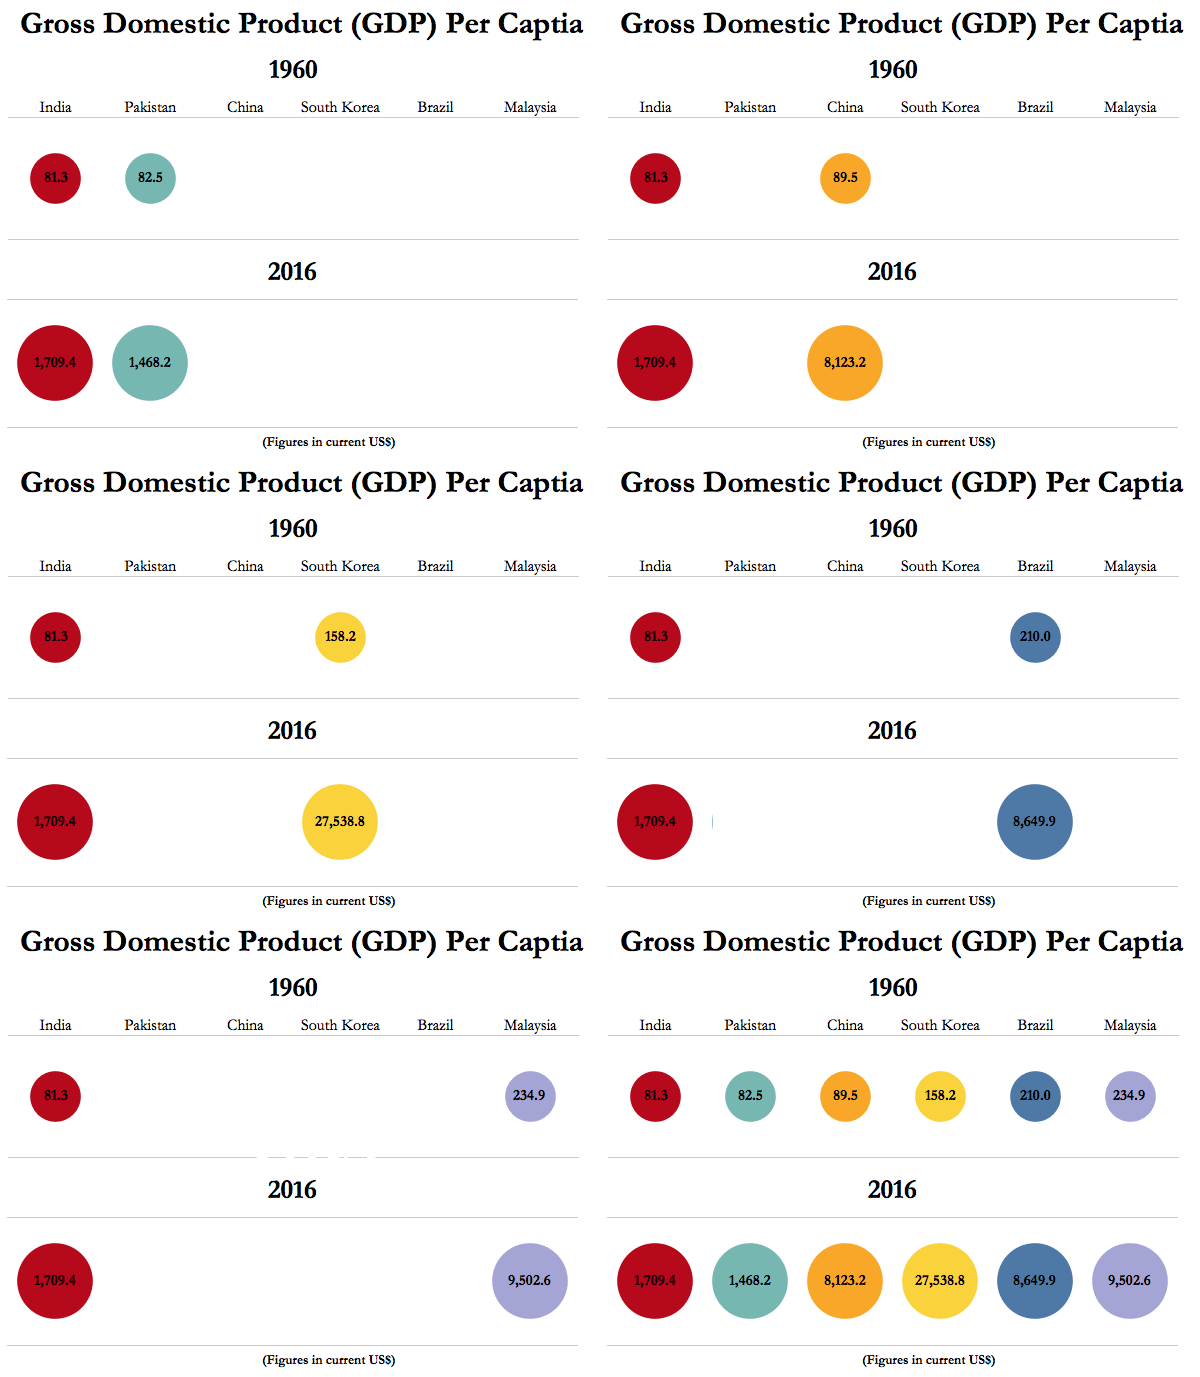
India’s Gross Domestic Product (GDP) per capita (current US$)--which is the average income of each citizen and reflects the well being of the population--increased 21 times from $81.3 (Rs 1,705) in 1960 to $1709.4 (Rs 1,14,530) in 2016, according to World Bank estimates. But India made slower progress as compared to China, Malaysia, Brazil and South Korea.
Source: World Bank; Figures in (current US$)
The GDP per capita is calculated by dividing the country's GDP by its population.
In 56 years, the gap in per capita GDP has increased most between India and China, in our comparison. In 1960, India’s GDP per capita ($81.3) was 9% lower than China’s ($89.5). In 2016, India’s GDP per capita ($1709.4) was 79% lower than China’s ($ 8123.2). This widening gap could be attributed to greater increases in productivity of the Chinese labour force and more capital per worker, according to an opinion piece published by The Hindu in January 2015.
Similarly the gap between India and South Korea in 2016 is nearly twice of what it was in 1960. South Korea’s growth can be attributed to rapid industrialisation and emphasis on sectors such as steel, shipbuilding and electronics, according to an April 2015 article by Quartz.
Until 1991, when India liberalised its economy, per capita GDP is estimated to have grown by an average of 4.7% per year, compared to an average of 7.5% every year after 1991.
India's GDP per capita in 1960 ($81.3) was 65% lower than Malaysia ($ 234.9), 61% lower than Brazil ($210), and 49% lower than South Korea ($158.2). Today India’s GDP per capita is 82% lower than Malaysia ($9502.6), 80% lower than Brazil ($8649.9) and 94% lower than South Korea ($27538.8).
India’s GDP per capita in 1960 was 1.5% lower than that of Pakistan ($82.5), which had progressed economically because of greater state capacity, investments in infrastructure and heavy industry and the agricultural revolution which started in Pakistan before it did in India, according to this September 2016 LiveMint article by economist Ankit Mital. But the situation has now reversed and India’s GDP per capita is 16.4% higher than its western neighbour.
Greater progress in improving life expectancy than Brazil, South Korea
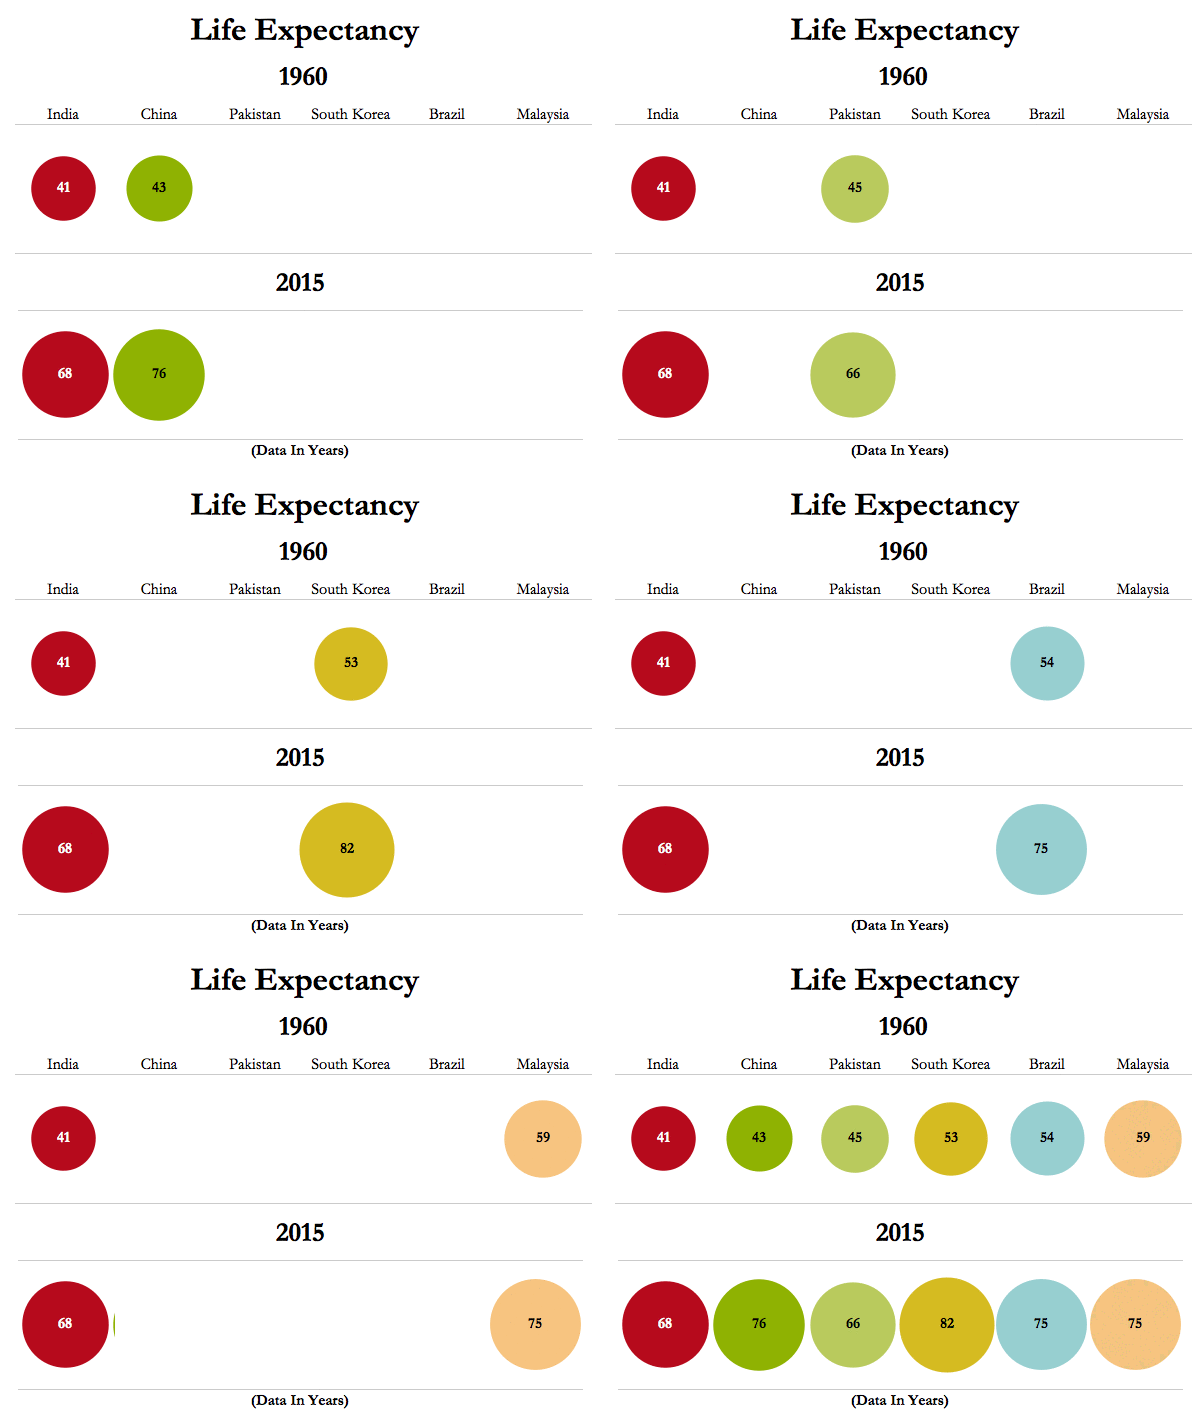
In 55 years, India’s life expectancy at birth--the average number of years a person is expected to survive if existing patterns of mortality stayed the same throughout their life--an indicator of the strength of the health system throughout the lifecycle of a citizen, rose by 65.8% or 27 years.
Source: World Bank
From 41 years in 1960, the average life expectancy at birth is now 68 years in 2015, the latest year for which data are available, according to the World Bank.
Among the five countries used for comparison, India’s progress in raising the average life expectancy at birth comes second to that of only China. In 1960, with an average life expectancy of 43 years, China’s position was close to that of India. However, in the same period the average life expectancy in China rose 76.7% or by 33 years to an average expectancy of 76 years in 2015.
Pakistan’s progress was on a par with India’s; life expectancy there increased by 65% to 66 years in 2015.
Between 1960 and 2015, Brazil’s life expectancy rose by 38.8% to 75 years, the life expectancy in South Korea increased by 54.7% to 82 years, and in Malaysia by 27% to 75 years, compared to a 65.8% rise to 68 years for India.
Still, India needs to catch up with the higher life expectancy at birth in these four countries, as well as with the global average, which was pegged at 71.4 years in 2015.
India’s efforts to reduce child mortality led to a significant decline in the death rate by 3.7% between 1990 and 2013, and is one of the main reasons for the increase in life expectancy at birth, according to this Public Health Foundation of India study from 2015.
Infant mortality rate reduces 76% over 55 years, but other countries did better
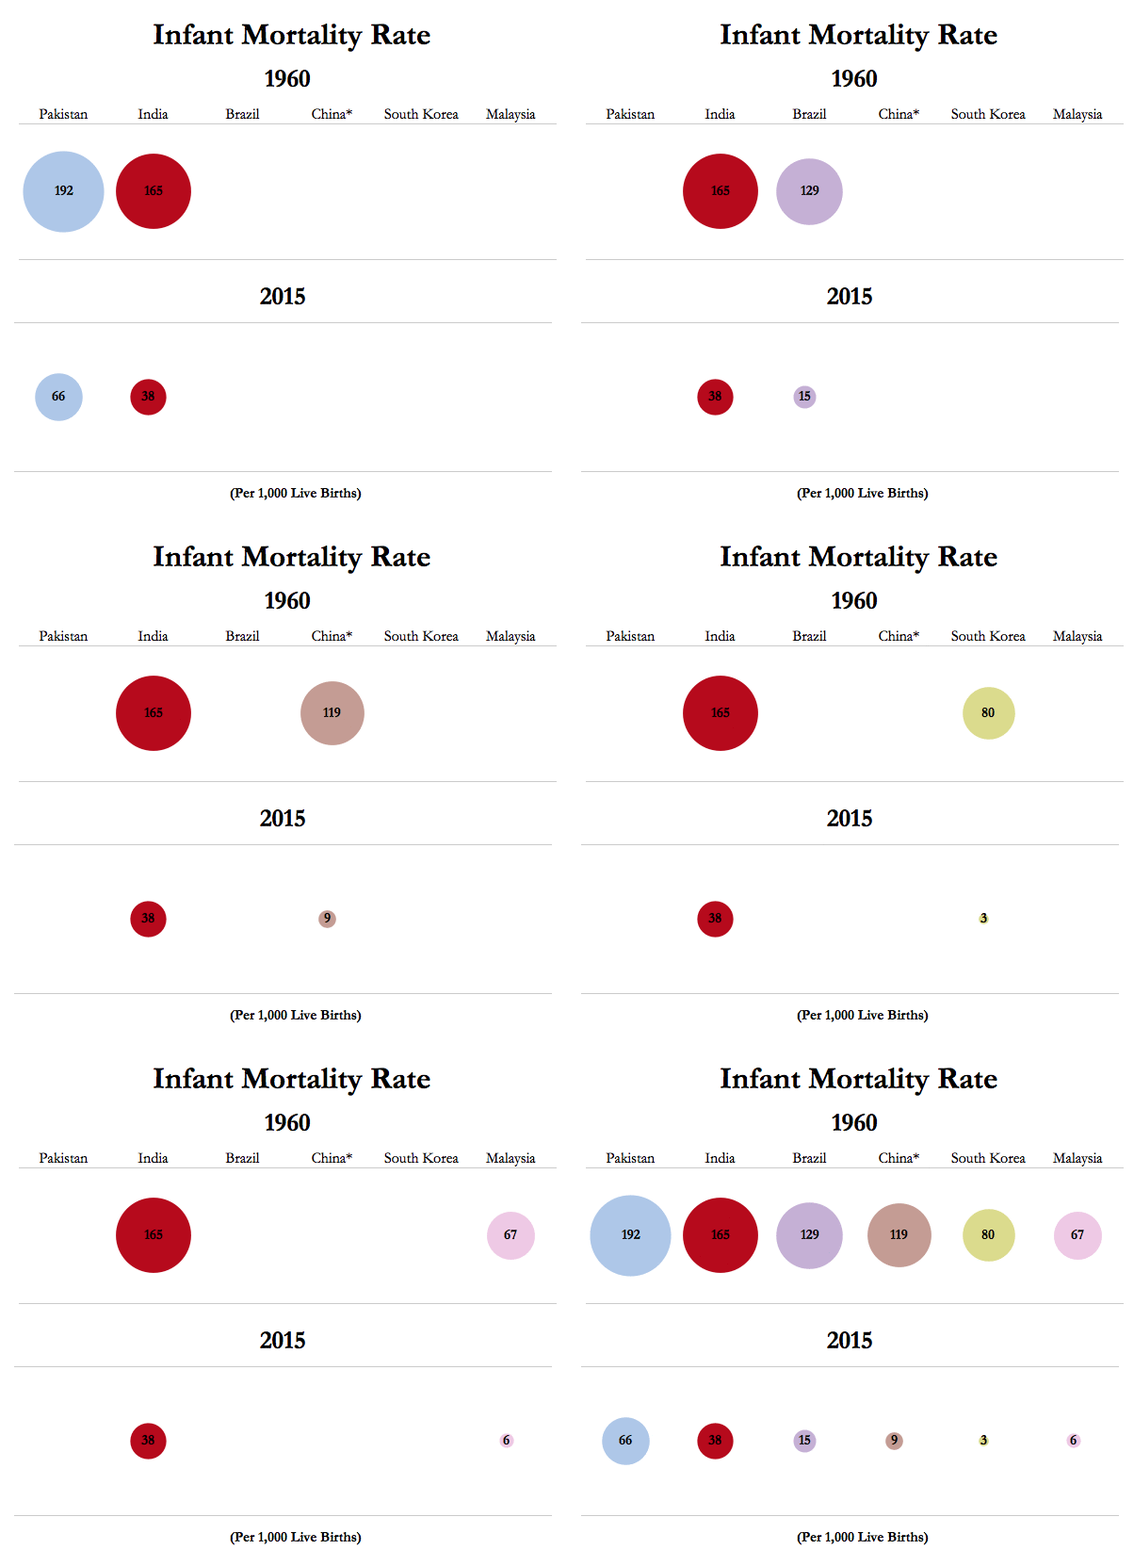
In 55 years, India’s infant mortality rate (IMR)--the number of babies per 1000 who died before their first birthday--an indicator of the strength of the health system, reduced 76% from 165 deaths per 1000 children in 1960 to 38 deaths in 2015, the latest year for which data are available, according to the World Bank.
Source: World Bank
Note: Figure for China is from 1969
But four of the five countries we used as comparison did much better than India, showing that though the IMR in India has fallen, progress in improving health systems has been slow.
Between 1960 and 2015, Brazil’s IMR reduced by 92%, the IMR in South Korea reduced by 96%, and in Malaysia by 91%, compared to a 76% reduction in India. China’s IMR reduced 92% between 1969 and 2015, compared to 73% over the same period in India.
The IMR in Pakistan reduced by 65%, the only country in our comparison that did worse than India.
The infant mortality rate is a good indicator of child health, and a ‘crude indicator of community health, poverty and socio economic status of a community and availability of quality health services and medical technology,” according to the Association of Maternal and Child Programs, a United States-based public health advocacy organisation.
India made progress comparable with China, Malaysia on literacy
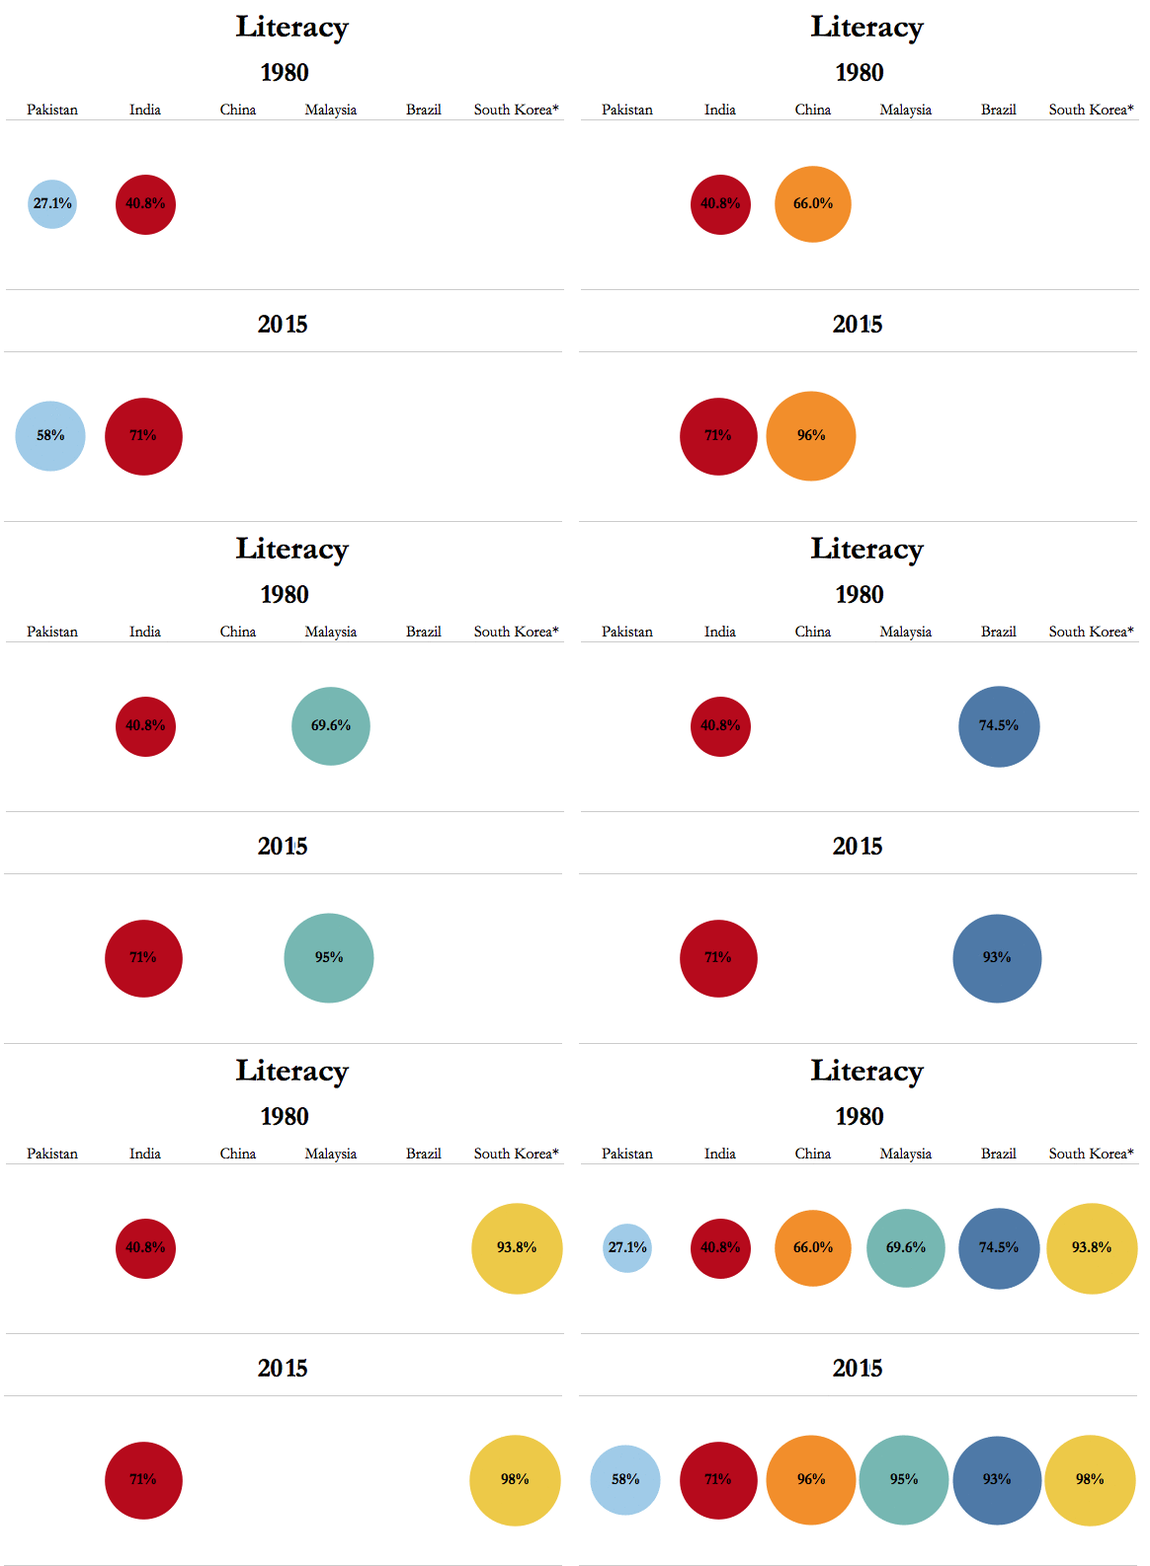
In 2015, seven of every 10 Indians, 15 years and above, could read and write a simple, short statement related to their everyday life, with understanding, according to estimates from the United Nations (UN). The share of literates in India’s population rose 30 percentage points since 1980--the earliest year for which data are available for this indicator--when four of every 10 Indians were literate.
Source:UNESCO, Foreign Policy Research Institute
Note: South Korea data for 2013
UNESCO Definition: A person who can read and write with understanding a simple short statement related to his/her everyday life
(In 1951, only two in every 10 Indians, five years and above, were literate, according to independent India’s first Census, which defined literacy as anybody who could “write a letter to a friend and…read the reply”.)
India has made equal or more progress than all other countries in improving literacy between 1980 and 2015--the time period over which comparative data are available--shows our analysis of India and five other countries, based on data from the United Nations Educational, Scientific and Cultural Organization.
As India started off at a lower level of literacy in 1980, the scope for progress was much greater compared to, say, South Korea, where 94% of the population, 15 years and above, was literate in 1980, or Brazil where 74.5% of the population was literate.
The gap between India, and Brazil, South Korea and Malaysia is now lower than it was in 1980, showing that India is catching up with these countries’ literacy rates. The share of literates in India was 53 percentage points lower than in South Korea in 1980, 29 percentage points lower than in Malaysia, 34 percentage points lower than in Brazil. In 2015, India’s literacy rate was 22 percentage points lower than Brazil, 24 percentage points lower than Malaysia, and 27 percentage points lower than South Korea.
The gap between India and China (~25 percentage points) has remained about the same as has the gap between India and Pakistan (~13 percentage points).
Forest cover increased in India, but numbers might be an overestimation
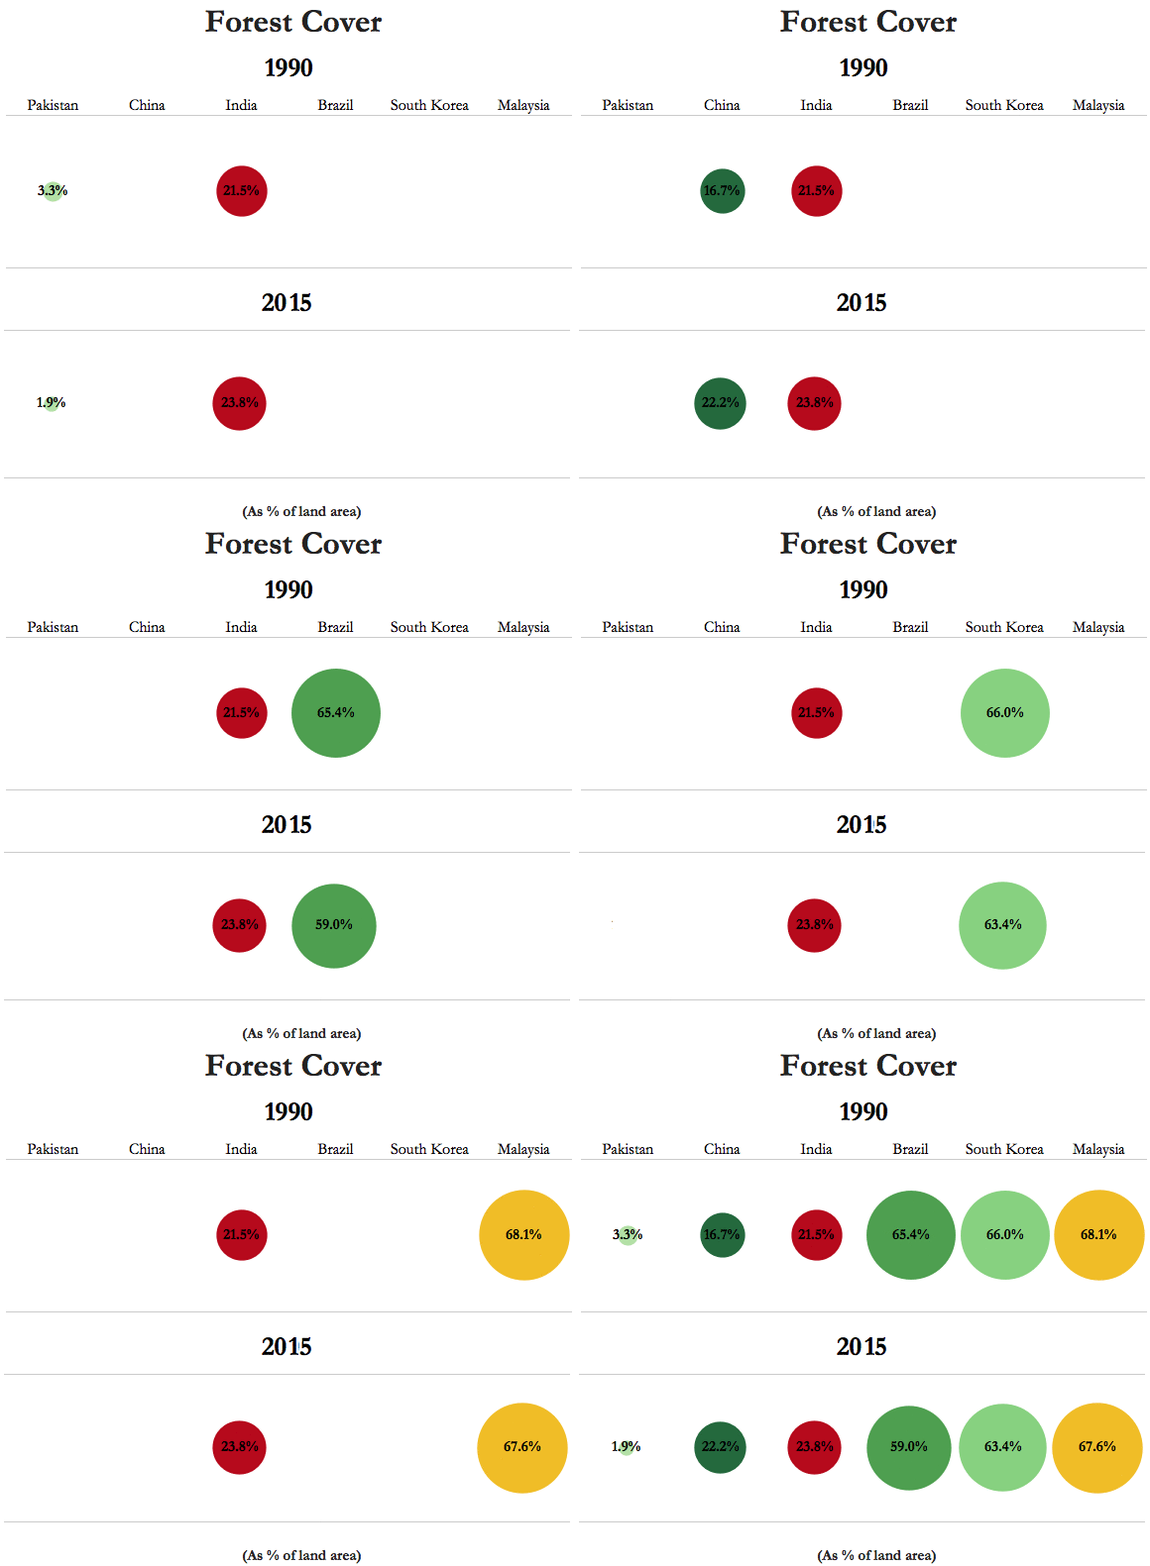
In 25 years, India’s forest area, as a percentage of total land area--an indicator of a country’s ability to clean its air and water, conserve biodiversity and mitigate climate change--increased from 21.5% in 1990 to 23.8% in 2015, according to data from the World Bank.
Source: World Bank
Note: Definition (FAO) - Land spanning more than 0.5 hectares with trees higher than five meters and a canopy cover of more than 10%, or trees able to reach these thresholds in situ. It does not include land that is predominantly under agricultural or urban land use.
India did better than four of the five countries we compared it with, in terms of preserving forest area, while China performed better than India, increasing its forest cover by 5.5 percentage points from 16.7% in 1990 to 22.2% in 2015. But the effectiveness of China’s reforestation programme is questionable, with large swathes of planted trees dying prematurely. Forest cover includes lands under afforestation.
The Food and Agriculture Organization defines forest area as land spanning more than 0.5 hectares with trees higher than five meters and a canopy cover of more than 10%, or trees able to reach these heights at maturity in that area. It does not include land that is predominantly under agricultural or urban land use.
The Indian government might be overestimating forest area as its definition of forests includes agricultural plantations.
Between 1990 and 2015, Pakistan, South Korea, Malaysia and Brazil lost forest cover.
The forested area in Brazil reduced by 6.4 percentage-points from 65.4% of total land area in 1990 to 59% in 2015, South Korea’s reduced by 2.6 percentage-points from 66% in 1990 to 63.4% in 2015, while the forest cover in Malaysia reduced by 0.5 percentage-points in the same time period.
Correction: A previous version of this story incorrectly said China’s GDP per capita ($89.5) in 1960 was 9% more than India’s, and 79% more than India's in 2016. The correct statement is that India’s GDP per capita in 1960 was 9% lower than China’s ($89.5), and in 2016, was 79% lower than China’s. We regret the error.
We welcome feedback. Please write to respond@indiaspend.org. We reserve the right to edit responses for language and grammar.
__________________________________________________________________
“Liked this story? Indiaspend.org is a non-profit, and we depend on readers like you to drive our public-interest journalism efforts. Donate Rs 500; Rs 1,000, Rs 2,000.”


