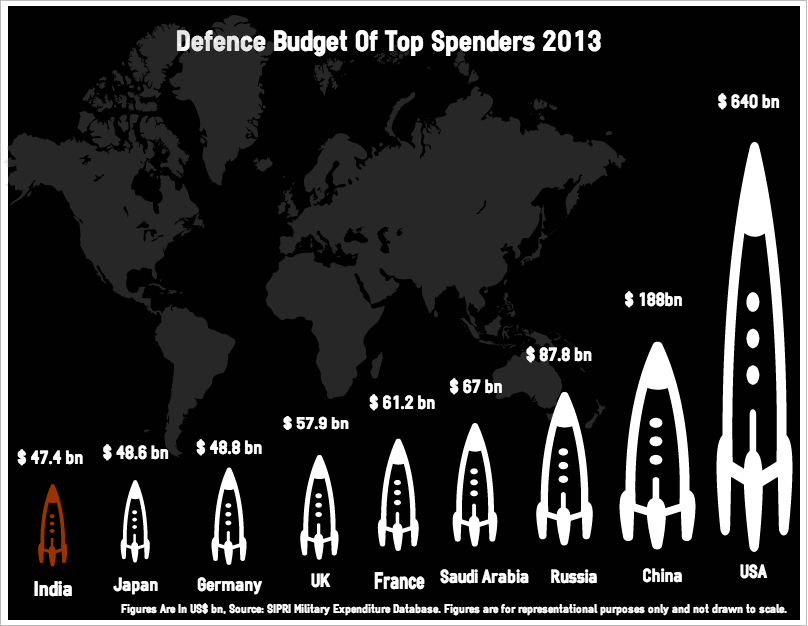
Chart: A Look At Global Military Expenditure

A recent report by Stockholm International Peace Research Institute (SIPRI) highlights that global military expenditure fell 1.9% in real terms to $1,747 billion in 2013, making it the second consecutive year of fall in expenditure.
Interestingly, the total expenditure of the top 15 countries comprised 80% of the overall global military expenditure.
The five biggest spenders for 2013 were the United States, China, Russia, Saudi Arabia and France. While United States topped the list with the highest expenditure at $ 640 billion, its spending had fallen by 7.8% YoY, mainly because of a reduction in overseas military operations.
China's spending increased 7.4% to $188 billion representing a long-term policy of rising military expenditure in line with economic growth. Russia's spending also increased 4.8% and its military burden exceeded that of the USA for the first time since 2003. It's spending as share of GDP increased to 4.1% in 2013 from 3.5 percent in 2003. India slipped a notch to 9th by spending $47.4 billion.
Among countries with high expenditure, Saudi Arabia had the highest military burden at 9.3% of GDP.
The map below plots 23 countries that have doubled their military expenditure in real terms between 2004 and 2013. In all these 23 countries, at least one of the following characteristics was prevalent - very strong economic growth, high oil or gas reserves or significant armed conflict or other violence.
Afghanistan has seen the sharpest increase since 2004 at 557% while its GDP grew by 123% during the same period.
To know about each country, one can click on countries that are highlighted and a drop box with information will appear.


