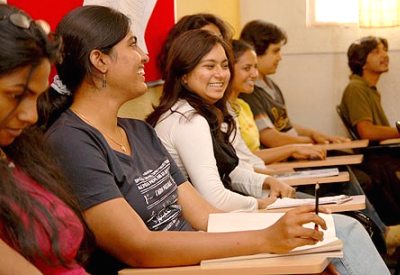
Gujarat Has Highest Reduction In Women Enrolment In Higher Education

| Highlights * Marginal increase in women enrolments. * Bihar sees highest increase in women enrolments. * Kerala also sees high dropout rates. |
Women constitute 48% of Indian population as per 2011 census but make up only 6 million of the 14 million students (42%) enrolled in higher education.
IndiaSpend’s Sourjya Bhowmick looks at 5-year data released by the Ministry of Higher Education in its latest Annual Report 2011-12 and finds that the percentage of women enrolment has risen only marginally (1%) to 41.5% in 2010-11 from 40.55% in 2006-07.
And yet, 7 states - Andhra Pradesh, Chhattisgarh, Gujarat, J&K, Kerala, Punjab and Uttarakhand – have seen a drop in women enrolment in higher education.
Gujarat leads the list here, in proportionate terms. Women enrolments are up in absolute terms over the last five years from 312,081 to 358,353 but down as a percentage to overall enrolment.
Interestingly, Bihar has the best percentage increase in women enrolment in higher education.
The Central Government has initiated several programmes like the Indira Gandhi scholarship for single girls (Rs 200 per month for two years and Rs 9 crore disbursed in 2011-12) to guarantee education for women.
Table 1 gives an idea of women enrolment in higher education in India and the ranking of the states:
Table 1: Bihar – A Surprise Gainer
| 2006-2007 | 2010-2011 | ||||
| States | Women enrolment | % of women | Women enrolment | %of women | % increase |
| Bihar | 150,114 | 24.5 | 215,748 | 31 | 6.5 |
| Himachal Pradesh | 48,240 | 44 | 66,114 | 49.5 | 5.5 |
| Orissa | 146,710 | 36 | 209,454 | 41 | 5 |
| Rajasthan | 146,783 | 34 | 298,750 | 38 | 4 |
| Haryana | 121,333 | 41 | 201,844 | 45 | 4 |
| Jharkhand* | 71,046 | 31 | 91,825 | 33.5 | 2.5 |
| Maharashtra | 659,231 | 41.5 | 858,313 | 44 | 2.5 |
*Jharkhand has a better % increase than Maharashtra due to rounding off.
(Source: Ministry of Human Resources & Development)
Bihar, Orissa, Rajasthan, Haryana and Jharkhand are considered backward states when it comes to social indicators. However, these are the states that have considerably improved their women enrolment.
Now let us take a look at the states which have seen a decline in enrolments:
Table 2: Gujarat Leads Reduction In Enrolment
2006-2007 | 2010-2011 | ||||
| States | Women enrolment | % of women | Women enrolment | % of women | % decline |
| Gujarat | 312,081 | 44.5 | 358,353 | 40 | 4.5 |
| Kerala | 211,914 | 61 | 229,494 | 56.8 | 4.2 |
| Delhi | 107,310 | 49 | 129,628 | 46.5 | 2.5 |
| Punjab | 160,633 | 52 | 234,176 | 50 | 2.0 |
| Andhra Pradesh | 387,124 | 40.3 | 718,894 | 38.9 | 1.4 |
| Uttarakhand | 62,106 | 42.5 | 121,563 | 41.3 | 1.2 |
(Source: Ministry of Human Resources & Development)
Kerala has more than 60% women enrolment, which is highest among all the states. Gujarat and Kerala rank number 1 & 2 with a decline of more than 4% enrolment in a period of 4-5 years. Delhi, which is the national capital, comes 3rd.
So, what can be the reasons for the decline in enrolments?
If we look at the UGC report on higher education we see that there exists tremendous academic and infrastructural gap in higher education as evident from the table below:
Table 3: Reasons For Reduction In Enrolment?
| Indicators | Average of all colleges | Benchmark ( A grade colleges) | Quality Gap |
| Total Number of Teachers | 47 | 78 | 31 |
| No.of teaching department per university | 29 | 34 | 5 |
| Number of sanctioned faculty position | 287 | 432 | 145 |
| Number of faculty position fulfilled | 220 | 329 | 109 |
| Total Number of Permanent Teachers | 39 | 54 | 15 |
| Total Number of Other teachers | 9 | 25 | 16 |
| Percentage of teachers without Phil/PhD | 57 | 0 | 57 |
| Overall teacher student ratio | 27 | 20 | -7 |
| Student Teacher ratio by permanent teachers | 33 | 30 | -3 |
| Number of books per college | 11,966 | 15,215 | 3,249 |
| Number of journals | 13 | 22 | 9 |
| Total Number of computers | 6 | 11 | 5 |
| Students per computer | 229 | 145 | -84 |
(-) is the reduction required; As on 2005....
(Source: University Grants Commission)
Unfortunately, state-wise data is not available on these parameters. From Table 3, we can see that there are major gaps in many factors, especially, teachers without MPhil/PhD. And student-teacher ratio is more than it should be. So, all these factors may well be reasons for the reduction in women enrolments.


