How To Pinpoint Delhi’s Air-pollution Sources
Delhi is at a crossroads in its approach to air pollution. Since the capital topped the World Health Organization’s list of most-polluted cities, the public has focused its attention on the issue and the government has responded with ever-stronger measures. Now the Indian Institute of Technology (IIT) Kanpur has released a long-awaited study that attempts to identify the sources of air pollution and inform the next wave of policies.
We at Evidence for Policy Design (EPoD) are engaged with government ministries in formulating and testing those policies. Yesterday, we described existing source apportionment studies--research that attempts to identify where Delhi’s air pollution comes from, be it exhaust from vehicles, smoke from fires, or dust from construction sites. These studies have had widely divergent results, in part because we lack a consensus on how to weigh different types of evidence. Comprehensive guidelines for source apportionment studies in India do not exist.
The new IIT-Kanpur study improves on previous attempts by taking seasonal variation in pollution into account, showing that vehicles are a much bigger contributor to air pollution in the winter than in the summer. The study also documents a broad range of sources like garbage burning, dust, and crop burning to paint a more complete picture of what’s causing air pollution in Delhi.
This study marks a good time for India’s regulators to implement a plan to commission these types of studies at regular intervals, using a regular set of metrics to track how pollution changes as the government intensifies its response.
Fine-grained data for a smart response
Source apportionment studies, even when done well, are not enough. They need to be complemented by a network of air quality monitors that offer a picture of air pollution in real-time, allowing citizens to protect themselves during periods of high pollution and helping policymakers target the most polluted areas of the city.
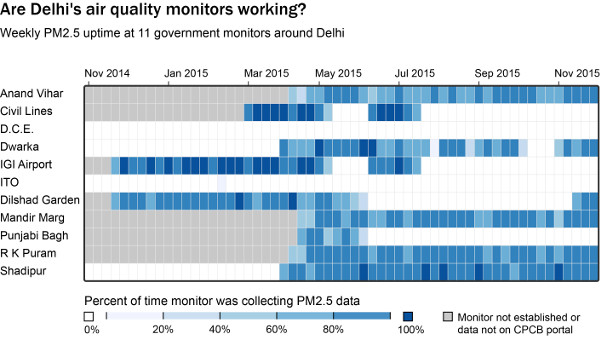
The backbone of Delhi’s air quality monitoring network is its set of 21 ambient air monitoring stations, 11 of which have data that are accessible to the public. The city’s main air pollution concern is PM2.5, suspended particles small enough to be trapped in the lungs. PM2.5 has been shown to cause lung cancer, cardiovascular and respiratory diseases, asthma, and a host of other health problems.
Data obtained from the Central Pollution Control Board (CPCB) website for the 11 monitors run by the CPCB and Delhi Pollution Control Committee (DPCC) show that PM2.5 was being recorded only 29% of the time at these sites last winter--the season associated with the most severe levels of particulate pollution. Coverage since March 2015 has increased to 46%, but these gaps in the data make it difficult to reliably characterise the actual air quality situation in the city. Continuing the trend of improvement in coverage should be a high priority.
For analysis, click here.
Coverage patterns show that monitor downtime tends to be concentrated in long stretches, when PM2.5 is not being collected for several months. This could be due to maintenance issues that are not detected or acted upon in a timely manner, pointing to problems with information flows and management within the organisations running the monitors. Paradoxically, these large gaps in data collection may be easier for the CPCB and DPCC to address than if monitors went down more frequently and for shorter periods. Making air pollution monitoring data easier for the public to access would be a good step toward creating the accountability that could help these organisations keep the city’s monitors functioning.
For the quality of air to improve, the quality of information must first rise. With even a rough idea of source apportionment, the government can take actions like shutting down dirty power plants and pushing neighbouring states to better regulate crop-burning. Once the low-hanging fruit is picked, policymakers will need increasingly detailed information on location, source, and type of air pollution to design a smart policy response. Now is the time to get the information systems in place that will inform the next decade of environmental policy in the city, and beyond.
(Eric Dodge is Data Analytics Lead at Evidence for Policy Design.)
Series concluded. You can read the first part here.
We welcome feedback. Please write to respond@indiaspend.org. We reserve the right to edit responses for language and grammar.
__________________________________________________________________
Liked this story? Indiaspend.org is a non-profit, and we depend on readers like you to drive our public-interest journalism efforts. Donate Rs 500; Rs 1,000, Rs 2,000.


