In 8 Years, Boys 3 Cm And Girls 1 Cm Taller
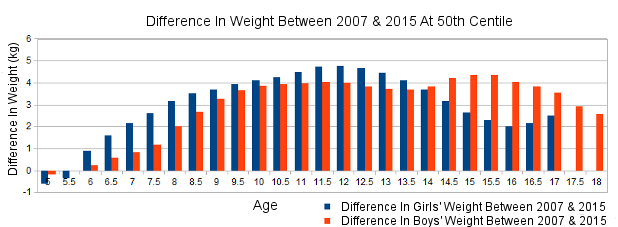
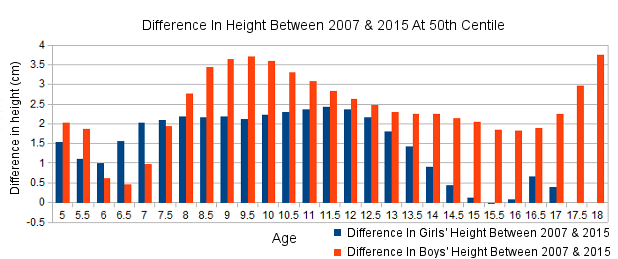
Eighteen-year-old boys from India's middle and upper classes are 3 cm taller and girls 1 cm taller than they were eight years ago, according to the latest growth charts published this year for children aged five to 18.
The growth figures--last updated in 2007, using data collected more than two decades ago--reveal upsides and downsides.
The new charts reflect the rise of taller and heavier urban children. Girls are taller earlier, but stop growing once they hit puberty, which is happening sooner.
“Boys and girls are heavier than before, and modern India is seeing a huge epidemic of obesity," said Vaman Khadilkar, consultant paediatric endocrinologist at Jehangir Hospital, Pune, and convener of the Indian Academy of Pediatrics' (IAP) growth-chart committee.
Source: Dr Vaman Khadilkar
Centile explained: If your 5 year old child is on the 30th centile of weight, it means 30 percent of 5 year olds weigh as as much as your child or less than her, and 70 percent are heavier than her. The 50th centile is the midway point where 50 percent of children are heavier than the 50th centile value and 50 percent are less than or equal to that value.
The authors have also revised the BMI charts which take into account both height and weight. The authors recommend using the BMI charts to identify overweight and obese children as they are equipped with new cutoffs – 23 and 27 for being overweight and obese respectively. The new cutoffs “match the adult equivalents for being overweight and obese” and are better suited for “Asian children”.
Convened in January 2014, the committee worked on the revisions and published its findings and charts in the journal Indian Pediatrics this year.
The new charts are based on contemporary data on growth and development of 33,991 children of upper and middle socio-economic groups living in 14 Indian cities.
How growth charts monitor growth
Growth charts answer questions that often plague parents: Is my child growing well or not? Is she gaining enough weight and height? The problem with those questions is, no matter how much we fuss, worry and compare with peers, we continue to doubt the answers.
A simple way to get rid of ambiguity and anxiety is to use a growth chart--an old but little-used statistical tool. Growth charts are graphs that show the ideal weight and height of a child at a given age.
Growth charts are great diagnostic tools, as they not only let you monitor your child's growth in normal conditions, they also make it easier to spot irregularities.
The charts are like a “standard that every child should attain and if she is not doing so, we need to find the reasons”, says Sanjay Wazir, director of neonatology, Cloudnine Hospital, Gurgaon.
He cites the example of a baby whose growth curve started faltering from the age of one, despite adequate nutrition. It emerged that the child had celiac disease.
Simple tools to diagnose childhood obesity--or malnutrition
Over the past few decades, for a certain section of society, good nutrition has ceased to be a problem.
Financial security has not only made sure that our plates are full, it has also caused a change in dietary patterns for many Indians.
As a result, obesity and the huge burden of lifestyle diseases that tag along have become rampant, as IndiaSpend previously reported.
Obese children have a greater chance of becoming obese adults burdened by lifestyle disorders. “The new growth charts are the best tools to diagnose obese and overweight [children] sooner," said Khadilkar.
However, while some Indian children are overweight and obese, many are malnourished.
So, how do these charts help children from both categories, and are they valid for poorer children, since they were created using data on children from the upper and middle socio-economic classes? Paediatricians advocate the use of IAP charts irrespective of socio-economic group.
“These charts should be used across all socio-economic classes, as they are prepared from a set of children who are believed to be living in an optimal nutritional environment in India," said Archana Dayal Arya, Senior Consultant Paediatric Endocrinologist, Sir Gangaram Hospital, New Delhi.
If paediatricians want to account for the nutritional divide between rich and poor and urban and rural children, “presently no growth charts are available that account for them or adjust for them”.
We do not have options other than to use one of these charts, said Neelam Kler, Chairperson, Department of Neonatology, Institute of Child Health, Sir Ganga Ram Hospital, New Delhi. Wazir concurred. “Given the limitation of ideal growth charts, the IAP charts are our best bet," said Wazir.
The argument for using Indian growth charts
The World Health Organisation (WHO) also provides growth charts for children in the five-to-18 age group to be used worldwide. But Khadilkar and his associates on the growth-chart committee believe IAP charts are better suited for Indian kids.
“Growth patterns differ amongst different populations, especially in children above the age of five, as nutritional, environmental and genetic factors, and timing of puberty seem to play a major role not only in the attainment of final height but also in the characteristics of the growth curve.” they write in their paper.
Hence, the need for country-specific growth charts. Many pediatricians appear to agree with this view. In an unrelated study, Vijaylakshmi Bhatia, paediatric endocrinologist at Sanjay Gandhi Postgraduate Institute of Medical Sciences, Lucknow, advises against using WHO charts for five to 18-year-olds as they are derived from “a group of children who are ethnically taller and heavier than our own high socio-economic group children”.
Some paediatricians differ. The methodology used for the IAP charts is “not very robust”, said Kler, although it has the advantage of “recent data and accounts for change in growth pattern in a developing country with changing economic conditions”.
WHO growth references are based on a dataset, that is “old but uniform”, uses “robust statistical methods” and “allows merging of the curve with under-5 growth charts”, said Kler.
For children under five, IAP also recommends WHO charts, which appear to have universal acceptability among the paediatricians.
Use the charts and stay away from supplements
While there may exist a debate about which charts to use, India does not have a great track record with monitoring children's growth.
“Although, there is no national data available, my estimate is only about 20% to 30% pediatricians plot growth”, said Khadilkar.
Parents and schools must also pitch in. Many schools record height and weight of children annually, but they fail to connect with a doctor to plot and interpret this data on a chart.
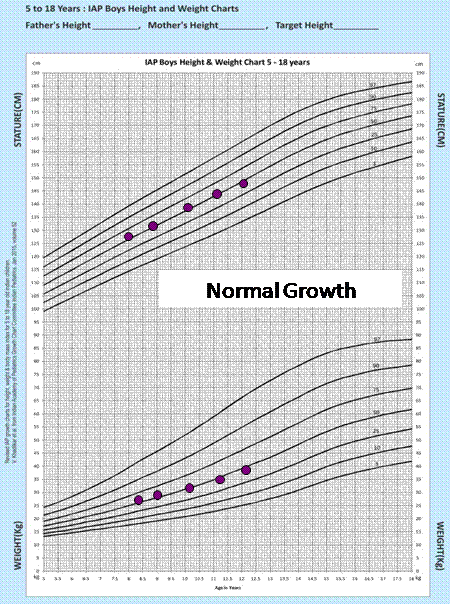
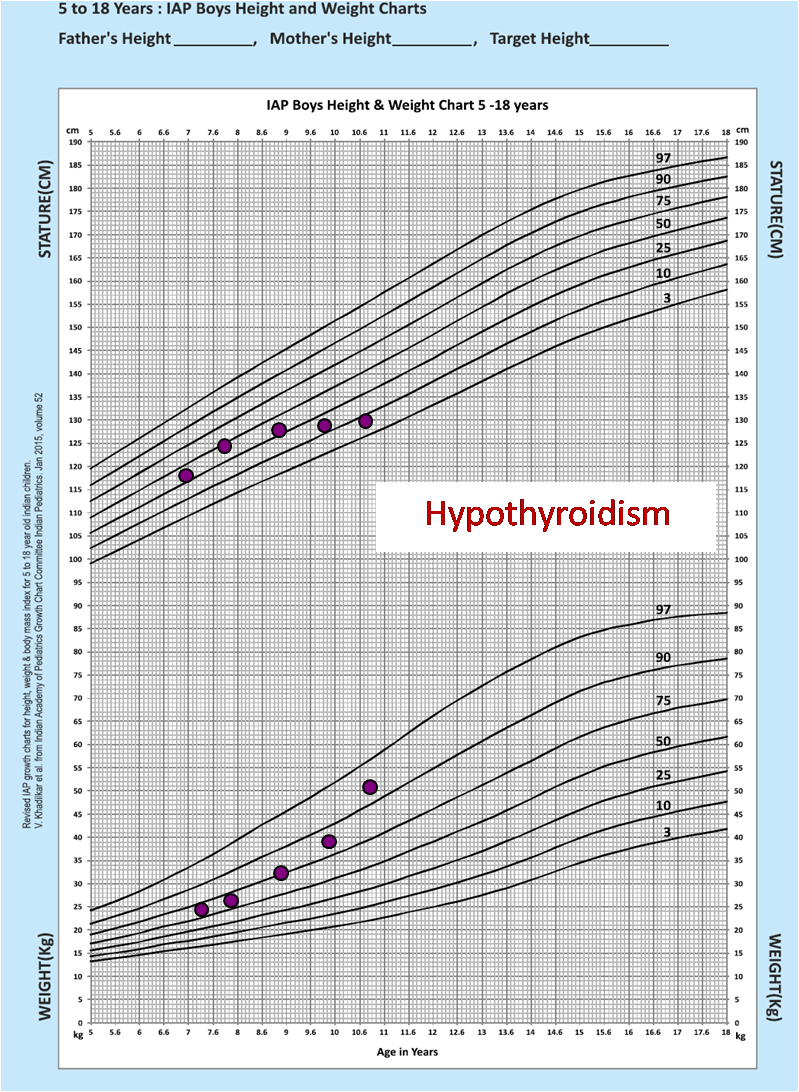
In growth charts, the x-axis is represented by age and the y-axis can be either height, weight, or BMI.
Source: Dr Vaman Khadilkar
This graph is never a straight line. Instead, it is made up of a series of percentile lines, usually including the 3rd, 10th, 25th, 50th, 75th, and 97th percentiles. A growth measurement that strays away from the lowest or highest percentile lines is considered abnormal, which means there are many different versions of a healthy weight and height.
What is critical, though, is that a child does not waver too much from one growth percentile to another over the years.
For younger children, especially under the age of two, frequent measurements are needed. Beyond the age of five, annual measurements are enough.
Rajesh Chandwani, a pediatrician and professor at IIMA has developed an app called Babysteps, to monitor the growth and development of children under the age of two.
Chandwani said older children, too, require height and weight monitoring, as many “growth-related disorders and nutritional deficiencies can be detected and managed".
All paediatricians interviewed for this piece described how plotting growth charts helped them. Its utility lies in “spotting developmental problems when a child jumps percentile lines on the chart”, said Arya. For, Kler the charts have helped in monitoring “growth of preterm babies, small for gestational age babies, in identifying short stature, and even in reassuring parents who feel--their child does not eat anything--that the child is growing normally".
In their concern about their children looking smaller than their peers, sometimes parents give food supplements to their children. This is not a good idea because it may “lead to diabetes, blood pressure and heart attacks later in life, especially for babies who were born small at birth,” said Wazir.
(Manupriya is a freelance science writer based in Bangalore).
____________________________________________________________________
“Liked this story? Indiaspend.com is a non-profit, and we depend on readers like you to drive our public-interest journalism efforts. Donate Rs 500; Rs 1,000, Rs 2,000.”


