Karnataka’s Missing Women Politicians & Bihar’s Abundance
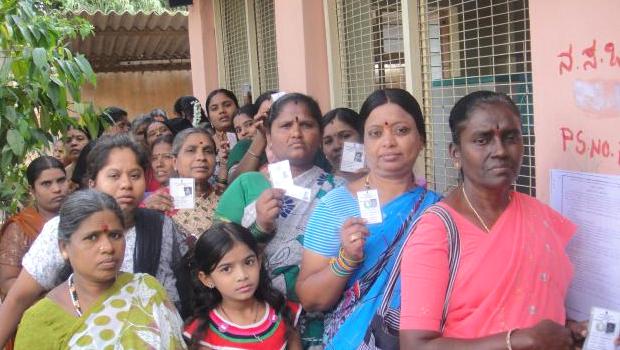
India’s southern state of Karnataka goes to polls on 5 May for a new 224-member legislative assembly.
The contest is being keenly watched for various reasons: First, to see if the outcome might set the tone for the 2014 Parliamentary elections. And to some extent what this augurs for the next phase of state elections in Madhya Pradesh, Rajasthan and Delhi within six months.
But what would be equally interesting, particularly in the context of increased awareness of women’s rights and participation, is how women candidates are faring in the overall electoral landscape?
And the answers are actually surprising. Not only does Karnataka have fewer women candidates but, more significantly, the overall participation of women in the electoral process appears to be dwindling quite sharply. Moreover, it’s not Karnataka that leads in women’s electoral representation but states like Bihar.
The Karnataka assembly, like many other state assemblies, has witnessed many acrimonious scenes. IndiaSpend earlier reported on how criminal records seem to be working in favour of electoral candidates.
As of now, data regarding the number of independent female candidates for the coming election is not available...but in the 2008 election, there were 107 women candidates and 41 were independents. Put another way, only 66 women got tickets from political parties in the 2008 assembly polls.And there were a total of 2,242 candidates, out of which 944 were independent candidates.
However, the 2008 assembly had only 3 women legislators, which amounts to 1.34% of members in the assembly. If we look at over 40 years of data (assemblies since 1967), the representation of women has always been in single digits – the sole exception being 1989 when there were 10 women legislators. Interestingly, there were no women legislators in the 1972 assembly.
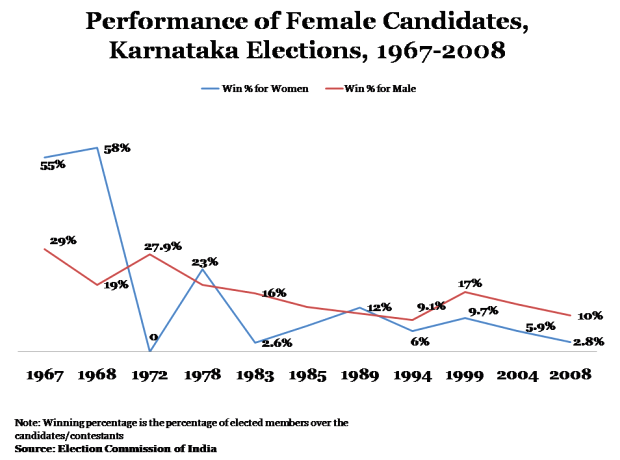
And there is a wide gap in the winning percentage of men and women in Karnataka. In the previous election (2008), only 2.8% of the contesting women won the elections. The best year was 1968 when over 58% women contestants wonthe elections but the overall participation of women as candidates was still as low as 12 out of a total 671 candidates.
Bihar A Surprise!
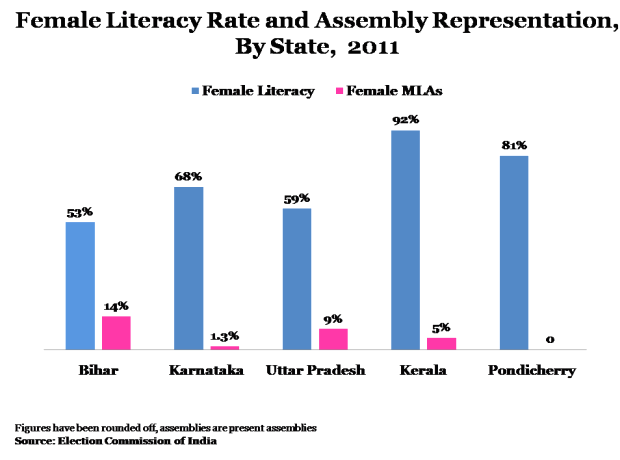
A national comparison: Bihar has the highest percentage of female legislators (13.99%) among the states, and Mizoram, Nagaland and Pondicherry have no women legislators. Karnataka has the lowest percentage (1.34%) of women legislators among the states.
Uttar Pradesh has the highest number of female MLAs (35) but proportionally, there are only 8.6% women in the Uttar Pradesh assembly.
Interestingly, if we compare female literacy to female representation in all these states, Bihar has the lowest female literacy amongst the states and the highest number of female legislators in the assembly.
Kerala, with a female literacy rate as high as 91% according to the latest census, has only 5% women in the assembly. Pondicherry with no women in its assembly has a female literacy rate of 81.2%, which is higher than the national average of 65.5%. So, there is no correlation between female literacy and female representation in state assemblies if one were to look for it.
Participation of women in elections as voters is also low in Karnataka. Keeping female voter participation over the years in mind, the 2008 election, however, had the lowest gap between the percentages of male and female voter turnout. And yet, a larger female voter turnout does not ensure more seats for women in the assembly!
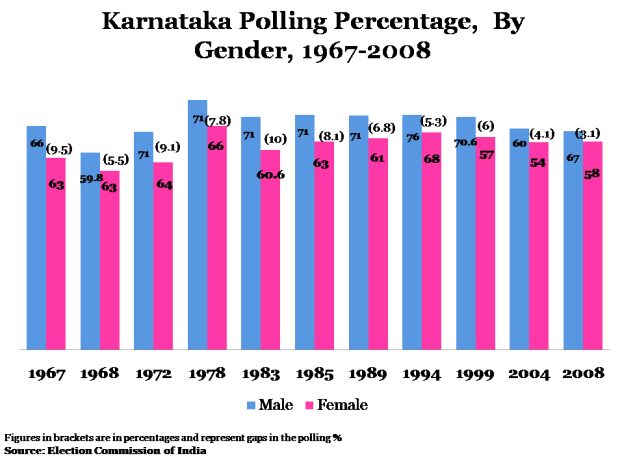
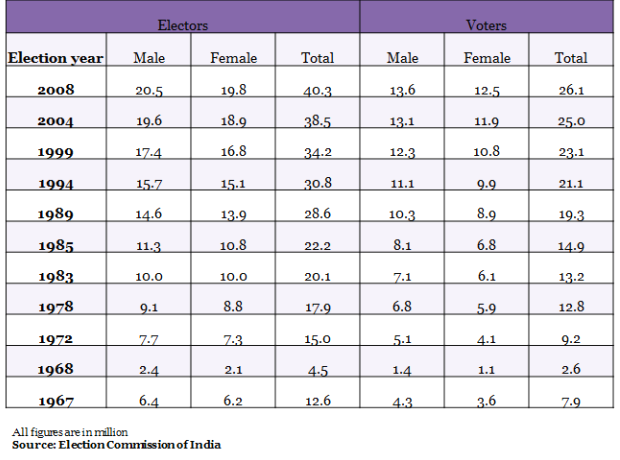
India is still grappling with low participation of women in politics. The 2009 Lok Sabha elections saw 60% male and 55% female voter turnout while Karnataka had a higher female voter turnout (63%) in the assembly elections.
So, has the electorate in Karnataka decided that single figure representation for women is adequate in the assembly? Or will there be winds of change in 2013? We will know when the results are announced on 8th May....


