Money That Went Abroad Illegally In 2007 = Estimated Cost Of Linking India’s Rivers
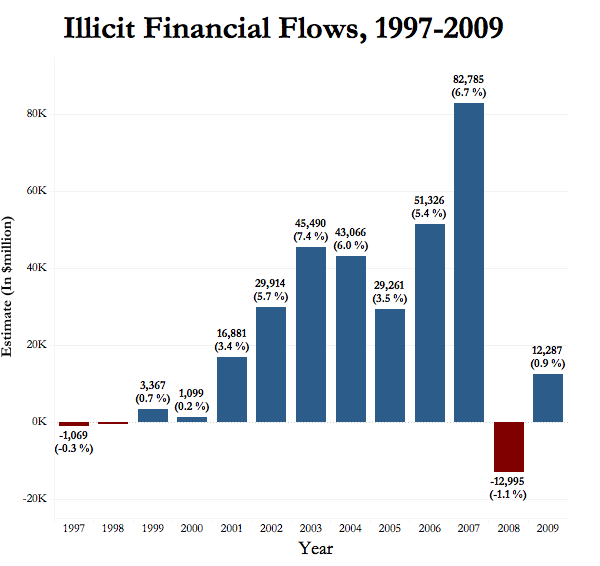
About Rs 5.3 lakh crore (at the current exchange rate of Rs 64/US dollar) flowed out of India illegaly in 2007, a government-commissioned report on black money has revealed. The amount is 5% less than the water resources ministry’s estimates (Rs 5.6 lakh crore) of the cost of linking the country’s rivers to address water scarcity and flooding.
Economic & Political Weekly, in collaboration with Business Standard, recently uploaded the National Institute of Public Finance and Policy (NIPFP) report on black money. The 1,200-page report, whose highlights Business Standard reported on May 3, 2017, and The Hindu reported in August 2014, is yet to be made public.
The report was commissioned in 2012 by and presented in 2013 to the Central Board of Direct Taxes (CBDT) under the Congress-led United Progressive Alliance (UPA) government. The report has not been released even by the current National Democratic Alliance (NDA) government.
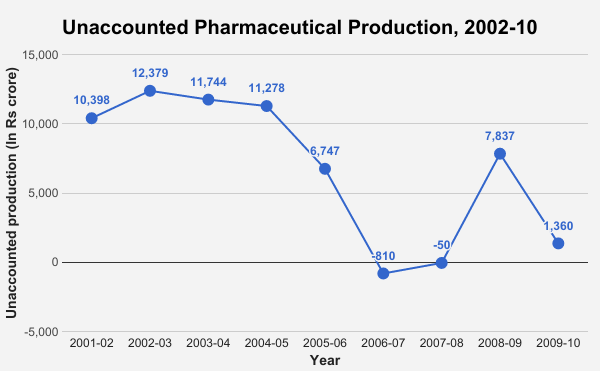
The pharmaceuticals sector generated Rs 46,200 crore black money in 2009-10--about the same as the amount Air India’s chairman said the airline needs in 2017 for a turnaround, according to this report in The Indian Express on May 15, 2017.
In 2010, under- or over-billing exports from or imports to India cumulatively generated about Rs 2.3 lakh crore (at the current exchange rate of Rs 64/$) of black money, 28% more than what the government plans to spend on the rural sector (Rs 1.87 lakh crore) and 4% less than what it has budgeted for roads, railways, shipping and other modes of transport (Rs 2.4 lakh crore) in 2017-18.
The flow of black money abroad ranged from less than 1% to 7% of India’s gross domestic product (GDP) between 2000 and 2010, according to the NIPFP report.
Exports are used for illicit outflows to countries such as the United States, the United Kingdom, China and Mexico. For countries such as Hong Kong, Netherlands, Switzerland and Singapore, both exports and imports are associated with illicit inflows or outflows.
While Singapore tops the illicit inflow chart, Switzerland tops the list of outflow destinations.
The NIPFP report identified 11 sectors as “more prone to generation or utilisation of unaccounted incomes”: chemicals and chemical products, construction, land transport, agriculture, petroleum products, iron and metallic products, electricity, communication, mining, machinery manufacturing, and trade and business services.
Real estate and gold and jewellery were identified as the sectors where major unaccounted incomes might be held as wealth.
Professionals big tax evaders
“At least for medical professionals, fashion designers, legal professionals,” the NIPFP report pointed out, “there is large scope for under/non-reporting income due to high incidence of cash/without-bill transactions.”
There is no relation between returns of income and service tax filed by professionals, clearly indicating rampant non/under-reporting of incomes and inflation of expenses, the report argued.
The report has suggested measures such as establishing benchmarks for likely range of professional expenses and improvements in tax forms to improve linkage between service tax payments and income.
Mining, pharma need better regulation
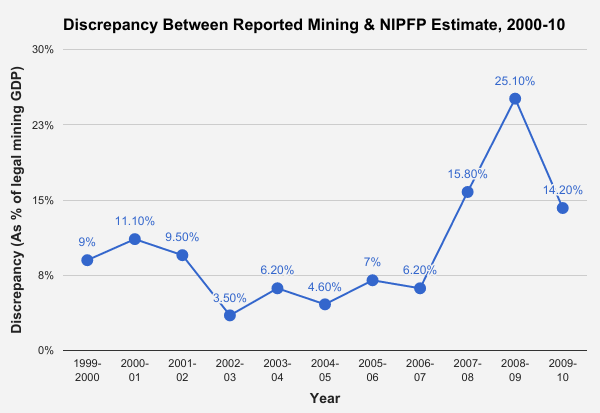
“Inadequate monitoring and regulation has resulted in extensive misuse of licences resulting in over-mining supported by widespread corruption,” the report said.
“The average unaccounted incomes as a percentage of reported GDP from the minerals… for the decade 2001-0 [sic]” has been estimated to be 10.32%, excluding illegal mining.
An earlier committee set up under Justice M B Shah by the UPA government to study illegal mining in seven states was abruptly wound up three years after it was constituted in 2010. The Shah committee could submit a final report only on Karnataka.
Lack of coordination between multiple regulatory agencies in the pharmaceutical
sector--a representative for the chemicals industry--has led to substantial under-reporting of sales and sale of spurious drugs between 2000 and 2010, the NIPFP report argued.
The share of substandard and spurious drugs (at licensed retail outlets and government stores, put together) has been estimated to be 3.16% and 0.0245%, respectively, according to The National Drugs Survey 2014-16 based on tests of 47,012 drugs samples.
While retail outlets account for 3% and 0.023% of substandard and spurious drugs, respectively, government stores account for 10.02% and 0.059%, respectively.
The large presence of small-scale units has also made monitoring difficult in the pharma sector, the NIPFP report noted.
The National Rural Health Mission (NRHM), the study pointed out, checked unaccounted sales in 2006-08 as NRHM procurement picked up. Government procurement isn’t enough to curb unaccounted production, which picked up again despite stable NRHM spending, the report showed.
Pharma companies should be issued single-use stamps to be pasted on each unit they produce, the report suggested, citing the use of prepaid tax stamps in American states to control drug trade.
Rs 11,000 crore black money from diverting PDS kerosene in 2011-12
Public distribution system (PDS) kerosene diverted to adulterate diesel (36% of total sales by volume, according to NIPFP estimates) created Rs 11,910.1 crore unaccounted income in 2011-12, the report estimated. The amount is 8% more than the government’s budget for the drinking water and sanitation ministry (Rs 11,005.24 crore), and 6% less than its budget for the women and child development ministry (Rs 12,733 crore) in 2011-12. Price control of kerosene and tax structure of both products are blamed for this diversion.
The leakage of PDS kerosene allocated in 2013-14 was 41%, according to data presented by petroleum minister Dharmendra Pradhan to the Rajya Sabha in July 2015.
The size of the black economy
Defining “unaccounted incomes as incomes not reported for the estimation of GDP”, the report estimated black money to be 41.7% of total estimated GDP or 71.5% of reported GDP in 2009-10.
One of the ways of estimating black economy assumes that the share of unaccounted incomes is reflected in the stock or flow of money in an economy. Since illicit transactions take place mostly in cash, any evasion from the official economy would raise demand for currency. By looking at the changes in currency demand, NIPFP has estimated the size of GDP from the known stock of money. The estimated GDP is then compared with the reported GDP. The difference between the two GDPs is the black economy, according to the NIPFP report.
India’s black economy was estimated to be 24% of GDP in 2007, according to a 2010 World Bank working paper. Arun Kumar, professor, Jawaharlal Nehru University, who wrote a book-length work on the black economy in India in 1999, has estimated it to have grown to 62% in 2013.
Economists typically use a physical indicator whose consumption is assumed to be related with unaccounted economic activity to estimate the size of the black economy. The NIPFP report used land freight transport because it is used as an input in all sectors of the economy. For instance, output from illegal mining will need trucks for moving extracted ore. In fact, unaccounted incomes in land transport and construction are derived from unaccounted activities in mining, the report argued.
Based on the use of trucks of average age 6-7 years for land freight transport, the report estimated unaccounted GDP to be 63.4% of the reported GDP in 2011-12. When the average age of trucks is considered to be 15 years, the share balloons to 164% in the year. The share of road transport in the country’s output was 3-5% between 1980-81 and 2010-11, the report estimated.
Based on proxy indicators for illicit economic activities (the ratio of money held in currency to that in demand and time deposits and other deposits), the report estimated the share of unaccounted income in total GDP has dropped to about 40% in 2009-10 from 70-75% in 1980-81. As a share of reported GDP, it has dropped to about 70% in 2009-10 from 200-300% in the 1980s.
The decadal average share of unaccounted income in GDP was 70-75% in 1980s, around 60% in 1990s and about 45% in 2000s. The report attributed this partly to tax and other economic reforms since the 1980s.
It cannot be definitively said whether high levels of taxation, unemployment etc, create black money or vice versa, the report cautioned, owing to paucity of data.
Limitations in estimating black economy
Among the limitations the report said it faced in analysing policy choices were the lack of organised and consistent data.
For instance, there were large discrepancies in information given by various authorities on mining, pointing to the unreliability of public data.
“The only authoritative figures of the sale and purchase of gold in India are from the World Gold Council,” the report said.
“It appears that most policy analysis would have to be based on hunches and guesses,” the report added.
The report has recommended moving from “the extreme unreliability of the Indian Mineral Yearbook” to technologies such as satellite imagery for the mining sector.
(Vivek is an analyst with IndiaSpend.)
We welcome feedback. Please write to respond@indiaspend.org. We reserve the right to edit responses for language and grammar.
__________________________________________________________________
“Liked this story? Indiaspend.org is a non-profit, and we depend on readers like you to drive our public-interest journalism efforts. Donate Rs 500; Rs 1,000, Rs 2,000.”


