Urbanisation Sounds Great But Who Has The Money To Fund It?
 Most planners and economy watchers would argue for greater and faster urbanisation. Many, however, would not be aware of the largely dismal condition of state and urban local body finances which could potentially support the great shift. Moreover, as IndiaSpend's Prachi Salve finds out, effectively, only 5 states in India have the financial and administrative ability to manage urbanisation at the pace at which we are witnessing today.
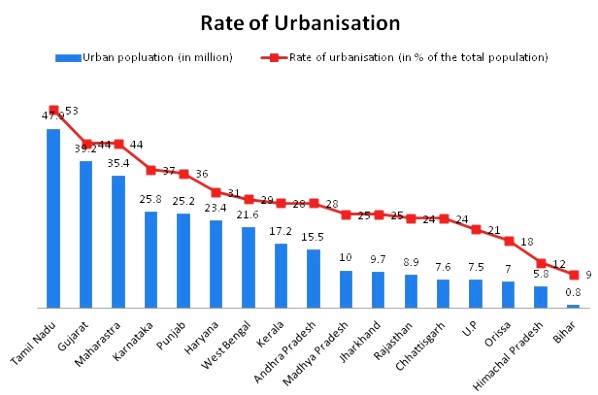
Economic growth always goes hand-in-hand with urbanisation, and it is evident that the most urbanised states are also the most developed ones. States like Gujarat, Maharashtra, Tamil Nadu and Karnataka are significantly more urbanised than Uttar Pradesh, Bihar and Orissa, and hence have higher state GDP.
On the other hand, states like UP, Bihar and Orissa already have burgeoning urban centers but lack the financial or organisational muscle to deal with the challenges and problems that will inevitably arise, if they've not happened already.
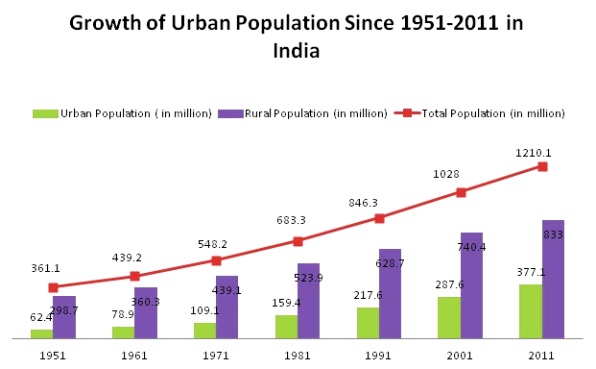
It can be seen from the following table that the rate of urban population growth has been picking up when compared with the rate of rural population growth.

India's urban population is expected to increase to 590 million by 2030.The number of towns has already increased from 5,161 to 7,935 from 2001 to 2011. Incidentally, India has over 600,000 villages. While addressing the annual convocation of IIM-Ahmedabad earlier this year, KV Kamath, Chairman, ICICI Bank and Chairman, Infosys Technologies, said the top three cities of India will grow to a size equivalent of countries today. E.g. Mumbai will grow from GDP of US$36 billion in 2010 to US$265 billion in 2030 (Malaysia GDP was US$220 billion in 2010). Similarly, Delhi and Kolkata would grow to GDP of US$250 billion and US$200 billion, respectively by 2030. The next six cities in 2030 are expected to become 2-4 times the size of Mumbai today!
Urbanisation Accelerates
The number of cities with a population of more than a million (considered an ideal definition of an urban centre) has increased from 35 in 2001 to 50 in 2011. In China, the contrasting figure 652 for cities with population greater than a million is 450
In 2008, five major states, namely Tamil Nadu, Gujarat, Maharashtra, Karnataka, and Punjab, had the highest rate of urbanisation and the highest population in urban areas (Table 2). According to a report from consulting firm Mckinsey & Co, this will increase pressure on India's already crumbling urban infrastructure services, currently suffering due to heavy backlog and population growth.

Status of Urban Development Finance
Now let's look at the finances of urban local bodies or ULBs which are in bad shape. Total municipal revenue is a mere 0.75% of the country's GDP, and ULBs account for only about 2% of revenue and expenditure of central and state governments.
The following table shows that most ULBs are dependent on grants from state and central governments. ULBs in states like Maharashtra, Gujarat and Punjab can meet their expenditure with almost no help from the state or the center. Then there ULBs in other states like UP, Jharkhand and Bihar that have almost no own revenue and depend heavily on central or state grants. It is not surprising to note that ULBs that are doing well are in states with higher rates of urbanisation.
Table 3: Municipal Bodies Revenue As A Percentage Of State GDP
| Major states | Own revenue as a percentage of the GSDP 2007-08 | Total revenue as a percentage of GSDP in 2007-08 (Incl Grants) |
| AP | 0.61 | 1.05 |
| Assam | 0.08 | 0.22 |
| Bihar | 0.09 | 0.62 |
| Chhattisgarh | 0.24 | 1.73 |
| Goa | 0.15 | 0.25 |
| Gujarat | 0.79 | 1.28 |
| Haryana | 0.14 | 0.42 |
| Jharkhand | 0.09 | 0.43 |
| Karnataka | 0.48 | 1.4 |
| Kerala | 0.17 | 0.44 |
| MP | 0.17 | 1.5 |
| Maharashtra | 2.14 | 2.81 |
| Orissa | 0.02 | 0.46 |
| Punjab | 0.72 | 0.81 |
| Rajasthan | 0.34 | 0.85 |
| Tamil Nadu | 0.48 | 1.26 |
| UP | 0.12 | 0.84 |
| Uttaranchal | 0.09 | 0.39 |
| West Bengal | 0.37 | 0.71 |
| Himachal Pradesh | 0 | 0.15 |
| J&K | 0.1 | 0.99 |
| Manipur | 0.05 | 0.2 |
| Meghalaya | 0.09 | 0.11 |
| Mizoram | 0 | 0.13 |
| Nagaland | 0 | 0 |
| Tripura | 0.09 | 0.51 |
Reasons cited for the poor performance of ULBs are imbalances in resources and responsibilities, (i.e. mismatch between functions and finances) borrowing constraints and inefficiency in management of services. The Planning Commission's Eleventh Plan has been applauded for its efforts to promote a renewed interest in urban areas and the implantation of reforms. The urban sector plan outlay has grown from 16.9% in 2007-08 to 28% in 2010-11.
This interest has also brought into focus the need for cities to be financially sustainable by tapping different sources of revenue like user charges and monetisation of land besides rationalising property taxes. The following table shows the state-wise break-up of the total outlay (from Eleventh Plan) for the urban sector for 2009 to 2011. The figures given below include allocations from the Rs 66,000 crore Jawaharlal Nehru National Urban Renewal Mission (JNNURM):
Table 4: Central Government Contribution To Urban Infrastructure
| State name | 2009-2010 (in cr) | 2010-11 (in cr) | Total Outlay Urban Sector | % share of the total outlay |
| Tamil Nadu | 2049.9 | 1820.2 | 3870.1 | 4.9 |
| Gujarat | 3242 | 3184.3 | 6426.3 | 8.7 |
| Maharashtra | 4465.4 | 3795.9 | 8261.3 | 13.1 |
| Karnataka | 4662.3 | 4499.8 | 9162.1 | 11.2 |
| Punjab | 158 | 137.3 | 295.3 | 0.6 |
| Haryana | 1318 | 785.7 | 2103.7 | 2.1 |
| West Bengal | 3069.5 | 3371.4 | 6440.9 | 8.3 |
| Kerala | 911.3 | 982.8 | 1894.1 | 2.4 |
| Andhra Pradesh | 2842.5 | 3756.3 | 6598.8 | 9.6 |
| Madhya Pradesh | 1081.9 | 1074.9 | 2156.8 | 3.1 |
| Jharkhand | 425.6 | 427.6 | 853.2 | 1.3 |
| Rajasthan | 2549 | 2291.6 | 4840.6 | 5.5 |
| Chhattisgarh | 1143.1 | 1027.1 | 2170.2 | 2.6 |
| U.P | 4616 | 4655.6 | 9271.6 | 11.9 |
| Orissa | 363.2 | 337.6 | 700.8 | 1 |
| Himachal Pradesh | 89.7 | 108.3 | 198 | 0.2 |
| Bihar | 1351.3 | 791.3 | 2142.6 | 2.6 |
| Arunachal Pradesh | 88.1 | 124.9 | 213 | 0.2 |
| Assam | 469 | 691.2 | 1160.2 | 1.2 |
| Goa | 158.1 | 166.2 | 324.3 | 0.4 |
| J&K | 275.1 | 313.8 | 588.9 | 0.8 |
| Manipur | 117.8 | 106.8 | 224.6 | 0.3 |
| Meghalaya | 92.2 | 146 | 238.2 | 0.3 |
| Mizoram | 116 | 106.8 | 222.8 | 0.3 |
| Nagaland | 363.2 | 337.6 | 700.8 | 0.3 |
| Sikkim | 185.8 | 207.3 | 393.1 | 0.4 |
| Uttarkhand | 899.5 | 495.7 | 1395.2 | 1.6 |
| Delhi | 1536.1 | 1943.5 | 3479.6 | 3.7 |
| Puducherry | 124.1 | 133.8 | 257.9 | 0.5 |
| A&N islands | 34.1 | 30.6 | 64.7 | 0.1 |
| Daman and Diu | 9.8 | 15.5 | 25.3 | 0 |
| Lakshadweep | 4.5 | 5 | 9.5 | 0 |
| D&N Haveli | 12 | 32.2 | 44.2 | 0 |
| Chandigarh | 245.3 | 223.8 | 469.1 | 0.6 |
| Total | 39069.4 | 38128.4 | 77197.8 | 100 |
Insufficient Drinking Water Supply
Let us now look at infrastructure….although availability of drinking water within the premises has increased to 71.2% of the urban population in 2011 from 65.4% in 2001, none of the cities have 24x7 water supply. In 2007, the demand for water supply in urban India was 83 billion liters per day but the amount supplied was only 56 billion liters per day.
Nearly 1,15,000 million tonne of waste is generated daily but there is a lack of scientific disposal and treatment of solid waste - most cities transport and dump the waste into land-fill sites. Public transport forms a mere 20% of the total urban transport in India. According to a high powered expert committee on financing infrastructure, 'Out of 423 class I cities, only 65 have a formal city bus service as of 2012, and that too owing to the intervention of the central government through the programme of funding of buses for city transport.'
The following table looks at the fund requirements for urban infrastructure services over the 12th Plan period (2012-2017):
Table 5: Estimated Cost For Urban Infra Svcs Over 12th Plan
| Sub-sector | Estimated Amount (In Rs Cr) |
| Urban Water Supply | 53,666 |
| Urban Sewerage and Sewerage treatment | 53,168 |
| Urban Drainage | 20,173 |
| Solid Waste Management | 2,212 |
| MIS | 8 |
| R&D and PHE Training | 10 |
| Total | 129,237 |
(Source: Planning Commission)
Many economists link urban growth and economic growth. Not everyone will agree but the fact remains that India is urbanising at a rapid pace. The problem is, as we've pointed out, the inability of urban local bodies to take on the infrastructure challenge. Fixing the problem at this level will take more than just large scale injection of funds.


