Will Karnataka’s Social Progress Deliver The Elections?
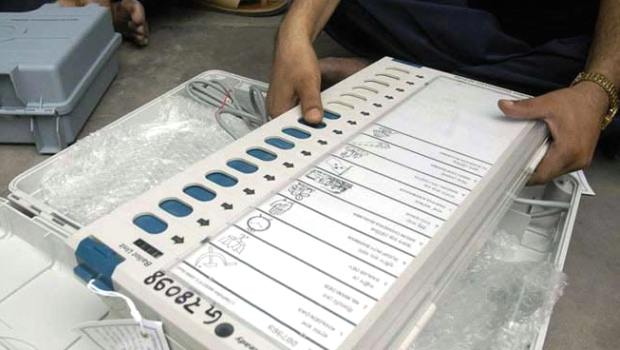
India’s southern state of Karnataka, which has a population of 61 million and is known across the world as the leader of Indian information technology, will elect a new 224-member assembly on 5 May.
What could influence the outcome? There are, of course, a multitude of factors but we look at two, the fiscal and the social balance sheet of the state. Whichever way the results swing, you could look back in the context of these two facets and judge for yourself.
Incidentally, Karnataka has seen six Chief Ministers since 2004 and two stints of President’s Rule, which gives an idea of how tumultuous affairs have been in the state.Presently, the state is being governed by Bharatiya Janata Party (BJP) and Jagdish Shettar is the Chief Minister.
Despite the shifts, the state’s fiscal conditionhas been stable. However, revenue surplus has been reducing for the last few years. A diminishing revenue surplus may mean additional fiscal burden because revenue expenditure has been increasing every year.
Meanwhile, health indicators like infant mortality rate (IMR) and child sex ratio are good compared to stable-governed states like Gujarat and socially progressive states like Kerala.
Let’s start with the fiscal indicators of the state:
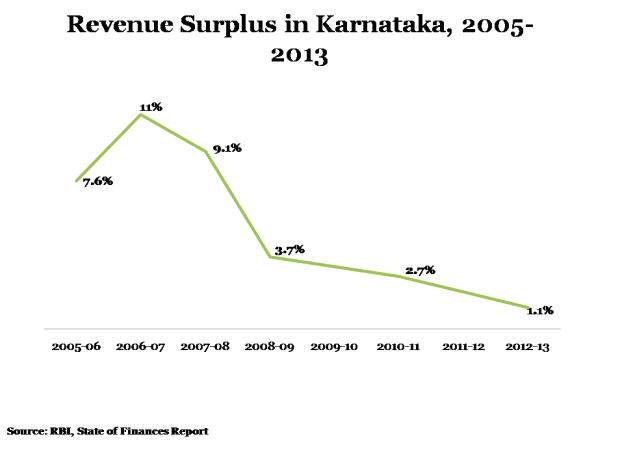
The chart suggests that Karnataka has been reporting a revenue surplus since 2006 but it’s also been declining every year. Incidentally, the state had reported a deficit of Rs 2,645 crore and Rs 524 crore in 2002-03 and 2003-04, respectively. Karnataka began reporting revenue surplus since 2004-05 when overall economic growth was strong across the country.
And this was the time when instability in the power structure started. However, the surplus started coming down since the President’s Rule (October 2007 to May 2008) and has continued throughout the current BJP Government.
The following table gives an idea of the revenue deficit, gross fiscal deficit, debt and expenditure on social sector and development as percent of the gross state domestic product since 2010-11 till 2012-13:
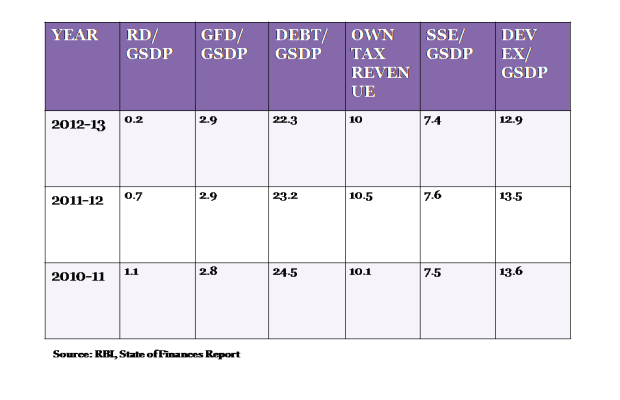
It can be observed that while gross fiscal deficit, social sector expenditure and own tax revenue remained constant, revenue deficit, debt and development expenditure have gone down over the last three years. The reduction in debt and revenue deficit could be seen as a good sign because it will mean productive investments such as building infrastructure while reducing development expenditure cannot be termed positive...
The following table gives an idea how Karnataka is doing compared to all states, and other industrialised states namely, Gujarat, Maharashtra and Tamil Nadu:
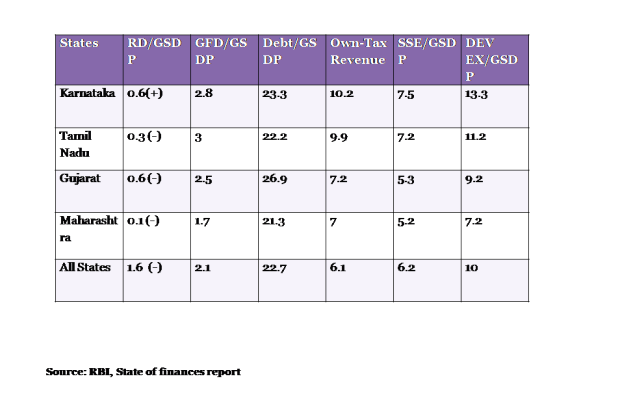
Karnataka (as the average of three years) is the only state of all the developed, industrialised states to have a revenue surplus (0.6%) as a percent of GDP – most states, on average, run a deficit. However, the gross fiscal deficit (GFD) of Karnataka (2.8%) is higher than all states average, and only Tamil Nadu has a higher GFD than Karnataka. It means that the state’s expenditure (revenue +capital) exceeds the revenue it generates and it has to be balanced with market borrowings.
Karnataka’s debt as percentage of GDP (23.3%)is also higher than all states and only Gujarat has a higher debt than Karnataka. The latter, incidentally, has the highest revenue from own tax sourcesbut also has the highest expenditure on social sectors and development out of all other states in the above table.
Let us now look at the social indicators of Karnataka.For better understanding, we will compare Karnataka’s health indicators with Indiaand with states that have strong social indicators like Kerala and Gujarat, which has seen a stable government.
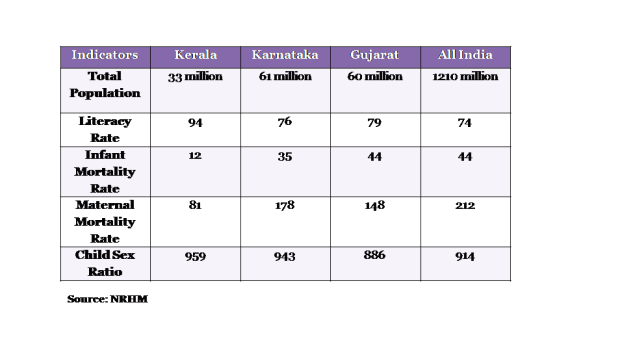
Karnataka’s literacy rate (76%) is evidently lower than Gujarat and Kerala but higher than All India.Karnataka’s Maternal Mortality Rate is long way away from Kerala and Gujarat but far better than the all-India level. The state is also doing well in child sex ratio (number of females per thousand males in the age group 0-6 years)compared to Gujarat and the India average. Only Kerala (959), Tamil Nadu (946), Assam (957), West Bengal (950) and Chhattisgarh (964) are ahead of Karnataka.
Karnataka has been improving its health indicators for the last few years. IMR, which was 41 in 2009, has been brought down to 35 in 2011.Likewise, MMR was 213 per 100,000 live births in 2004-06 and is now down to 178 in 2011.
Now let’s look at some education indicators of Karnataka, and compare them with the national average and with Kerala and Gujarat:
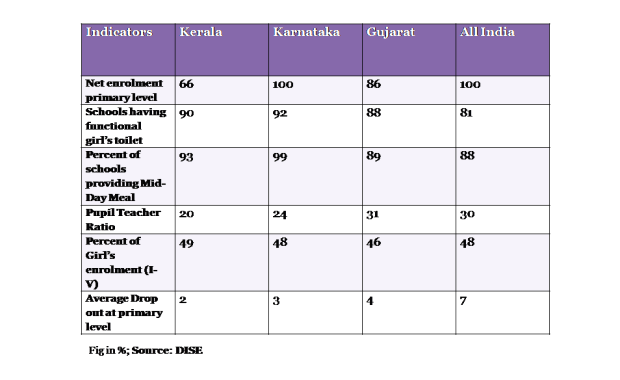
It can be seen that Karnataka has a far better net enrolment percentage, more schools with functional girls’ toilets, schools providing mid-day meals and better percentage of girl enrolments... Karnataka’s average drop-out at the primary level was 5% in 2007 but has been brought down to 3% in 2011 as against the national average of 7%. These figures (including table) refer to Government schools.
Karnataka’s fiscal balance sheet is weaker than its social balance sheet. Which of these factors will influence the electoral outcome in the state is, of course, anybody’s guess.
| Glossary Revenue Deficit- When the net amount received (revenue less expenditure) falls short of the projected net amount to be received it is Revenue Deficit. It occurs when revenue received and actual expenditure does not correspond with predicted revenue or expenditure figures.
Revenue Surplus- It is excess of revenue received over revenue expenditure.
Gross Fiscal Deficit- When a Government’s total expenditures exceed the revenue that it generates, excluding the money from borrowings.
Social Sector Expenditure- The provision of benefits to financial contributions targeted at households and individuals in order to provide support during circumstances which adversely affect their welfare.
Infant Mortality Rate- Number of child deaths (less than 1 year age) per 100,000 live births.
Maternal Mortality Rate- Annual Number of female deaths per 100,000 live births. |


